- Fri 11 May 2012
- Cartographica
- Rick Jones
- #census, #disease, #health, #join
The Center for Disease Control monitors various diseases within the United States. Often the CDC produces data for public use that can be used for scholarly and educational purposes. For this post I downloaded diabetes data from 2009 from this CDC website. The CDC are available for download in .xls format, so they need to be converted for use in Cartographica. After the data are downloaded, load the files into a spreadsheet program and save the file as a .csv. According to CDC data more than 25 million Americans have been diagnosed with diabetes and the rates of diabetes have continued to grow over the past decade. The CDC data are recorded at the county level so you should download the Current County and Equivalent county shapefile from the U.S. Census to join with the CDC data. Import the downloaded county shapefile into Cartographica by choosing File > Import Vector Data.
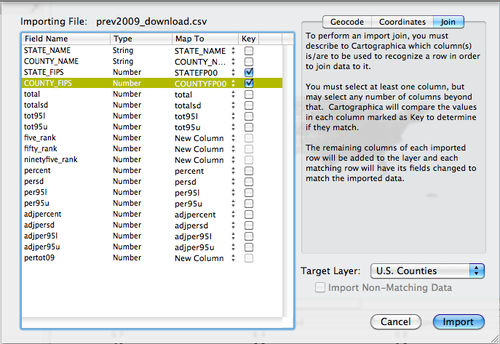
To join the CDC data to the county file, choose File > Import Table Data. This will bring up the Import File window. Select the Join tab in the top right. This tells Cartographica that we are going to join the table data to another file. Next, change the Target Layer to the U.S. County file. In order to join the CDC data to the U.S. Census county file we need to join based on County FIPS and State FIPS codes. The CDC data has two columns that contain the County and State FIPS codes. Sometime FIPS codes are given as a single number that includes both county and state FIPS codes. However, the FIPS codes are also given in two separate columns, which is the case with the CDC data. Cartographica can join data based on one column or based on more than one column which is very helpful in the present situation. To select multiple columns change the Map to option to the appropriate column in the U.S. Counties file and the check the Key boxes next to the columns in the Import File Window. I provide an image below of the set up.
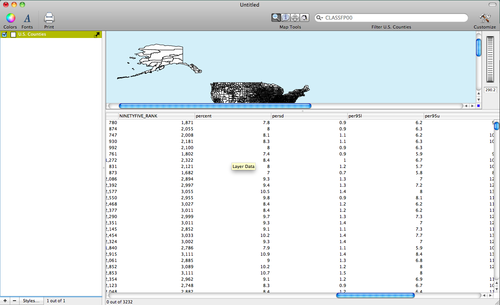
After the data are joined to the County file they are viewable in the data viewer below the map window. I show an image of the data viewer with the CDC data joined below.
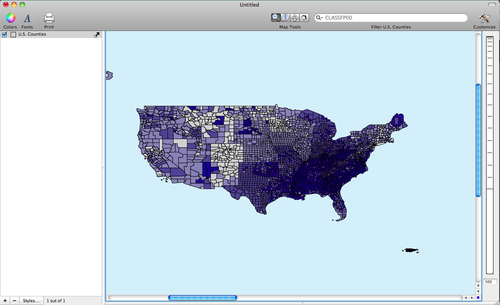
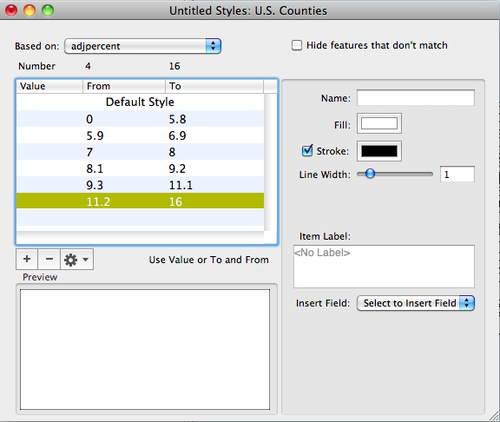
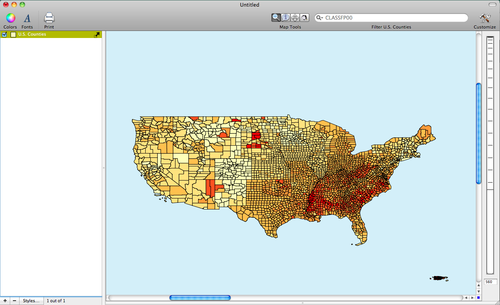
Finally, we can reproduce the maps shown on the CDC website by double-clicking on the U.S. Counties layer in the layer stack. This will bring up the Layer Styles window. To create my maps I used six categories, which are added to the table in the Layer Styles window by clicking on the plus button six times. To determine the interval sizes of the categories you can use any of the classification methods, but for these maps I used the Natural Breaks (Jenks) classification. To change the color I chose Window > Show Color Palettes and then I dragged the color scheme to the table in the Layer Styles window. I provide an image of the Layer Styles window and several maps I created using the CDC data.
The distribution of Diabetes across U.S. Counties
The distribution of diabetes across Southern U.S. Counties.
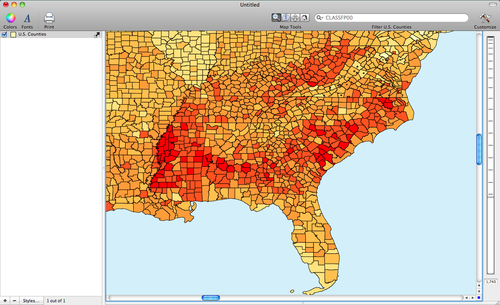
Here is the same map, after applying a different color scheme.