- Tue 24 April 2012
- Featured Maps
- Rick Jones
- #drones, #kernel density, #kml, #geodata, #Cartographica
In an article released last week it was reported that the Federal Aviation Administration has released the names and locations of Organizations approved for flying drones within the U.S. Drones have become infamous over the past several years due to their use for military purposes in Afghanistan, Pakistan, Iraq, and many other places. The use of the military technology for domestic purposes should not be unexpected as we have seen many military technologies cross-over for domestic purposes. Many argue that the use of such Military technology in local police agencies may be problematic and seen as an increase in domestic law enforcement power. Many argue that the use of these types of technology against the citizenry represents an unnecessary use of military strength. However, it can also be argued that use of military technology in civilian life has been beneficial. One glaring example is the use of GPS. Did you know that GPS was originally a military development?
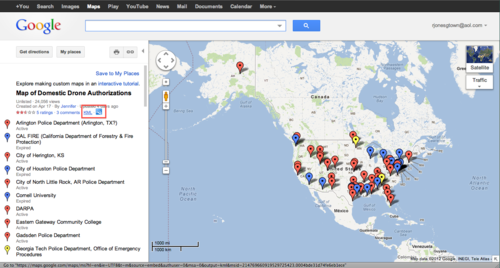
In the article liked above a map is shown that can be quickly and easily reproduced in Cartographica. If you click on the map in the article it will take you to Google Maps which then allows you to explore the data. However, we can also download the data and import it into Cartographica. To download the data click on the KML link on the left side of the Google Maps window. This will automatically download the data. I provide an image below of the Google Maps page and highlight where the KML link is located.
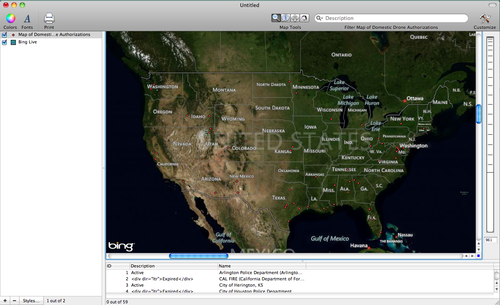
Next, open Cartographica and then import the KML file by choosing File > Import Vector Data. This will automatically import the KML file into Cartographica. You can also add a base map for context by choosing File > Add Live Map. I provide an image below of the data.
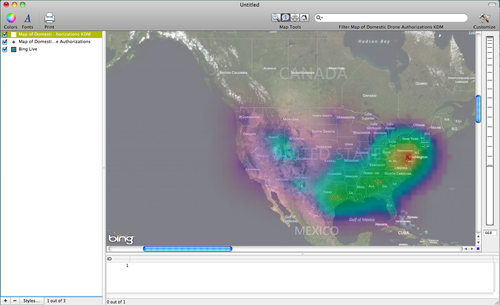
Next, we can use Cartographica for more than just viewing the points. We can also create interesting additions to the map. To create a Kernel Density Map use the identify tool to select only the locations in the lower 48 states (notice there is one location in Alaska, we will ignore that location for now). Next, hold down the option button and choose Tools > Make Kernel Density for Selection... Next, you can select the type of Kernel you would like to use. For the map below I used the Negative Exponential kernel. To make the map more transparent you can double click on the KDM layer in the layer stack and change the opacity. Also you can change the color palette by choosing Window > Show Color Palettes. Choose the color palette and then drag it to the KDM layer in the layer stack. The color palette I used was downloaded from Color Brewer. See the Color Brewer with Cartographica blog post for more information on using Color Brewer. My KDM map is shown below.