- Tue 10 April 2012
- Cartographica
- Rick Jones
- #buffer, #nuclear, #raster
Recent reports have indicated that North Korea is planning a nuclear weapons test in the near future. The possibility of this test has been confirmed by multiple governments including South Korea and the United States. According to this article by the Associated Press1 North Korea successfully performed two nuclear test in 2006 and 2009. The nuclear tests have come under scrutiny by the United States and other countries. The discovery of the nuclear test came through observations made by satellite imagery of the test site location. Take a look at this article's satellite imagery. Simultaneously, North Korea is also planning a launch of a satellite that many argue is similar to a missile test. Unfortunately, the satellite imagery used to detect the nuclear launch has not been made available online. Instead, we can use Cartographica to map the situation.
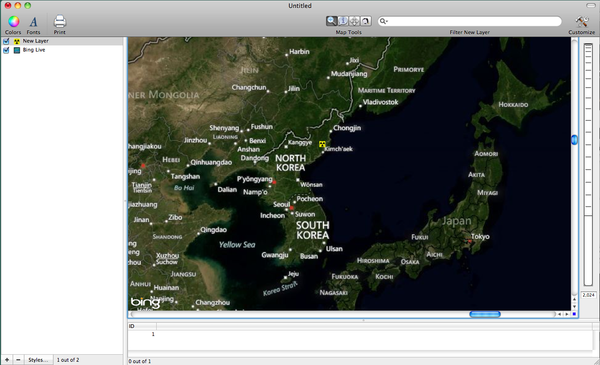
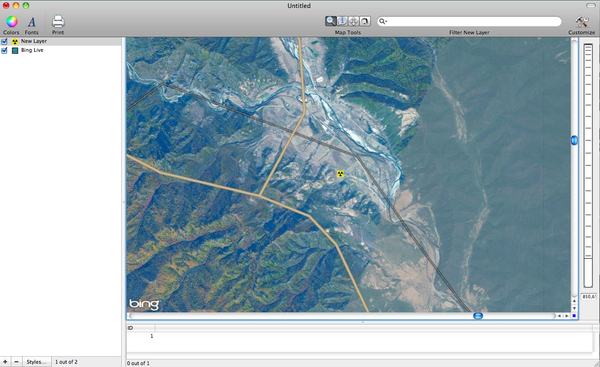
To map the area, I am using Cartographica's Live Map. You can add a Live Map by choosing File > Add Live Map. Add the Live map with Roads on top of aerial imagery. To determine the location of the test site I used information I found in various news releases. The area of interest is near the North Eastern Coast of North Korea. The Image below shows a map of North Korea and the general vicinity of the test grounds. To add the point feature click on the + button at the bottom of the layer stack to add a new layer. Next, choose Edit > Add Feature. Locate the position where you would like to place the point and the hold down the option button and place the point.
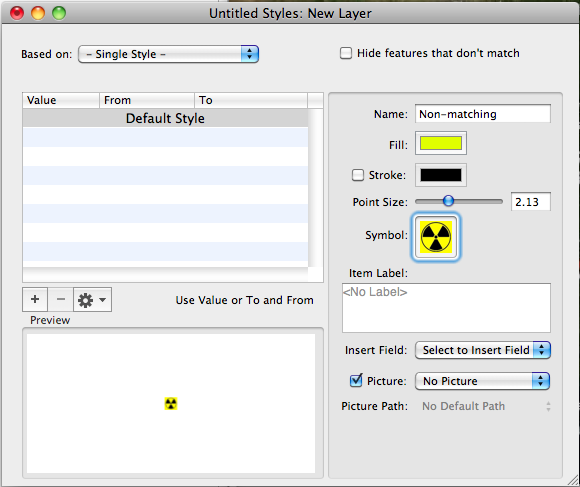
Notice that my map of the area uses a nuclear activity icon to indicate the location. Cartographica can use virtually any image to create a symbol for mapping purposes. To create this nuclear point I used the search term "nuclear" in Google's image search and then simply clicked and dragged the image into the symbol box in Cartographica's Layer Styles window. I provide an image below.
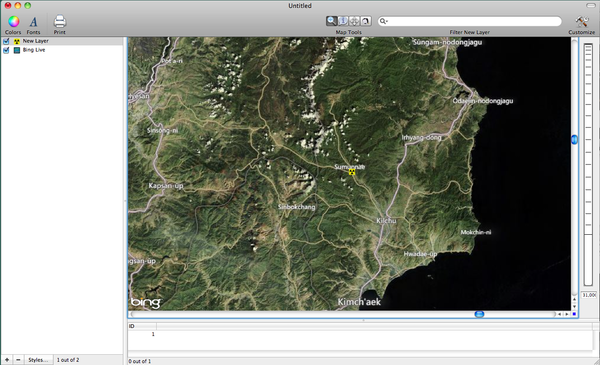
The next images show several closer looks at the area. It appears that the test location is near the confluence of two rivers. The area appears to be very secluded and in heavy mountains with rough terrain.
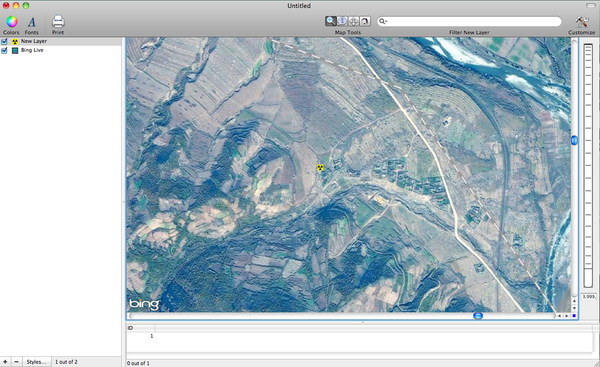
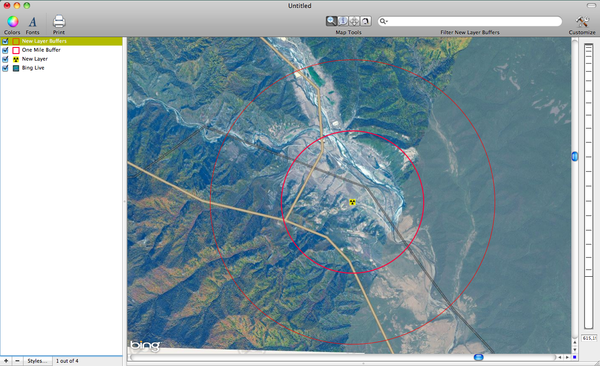
For the last image I added two buffers to show the distances around the test location. To add buffers select the point layer in the layer stack and then choose Tools > Create Buffer for Layer's Features. I chose to create buffers of one and two miles. The test location is likely within these buffers. The test will occur underground and the digging of the tunnels is what alerted many governments that there was a potential nuclear test upcoming. I have not been able to find new imagery that definitively shows the exact location of the test site. I am sure these images exist, but they are currently unavailable.
-
Article no longer available from the Google AP feed. ↩