- Mon 21 June 2010
- Cartographica
- Rick Jones
Agriculture is one industry that has great interest in using Geospatial analysis for improving production and conserving and protecting land quality. Monitoring such things as water usage, growth, crop production, and many other related features of farming can greatly impact what is grown, how it is grown, and the ways in which agricultural products are processed.
In this post, data on U.S. agriculture production were collected from The National Atlas Website, which has several data sets that are useful for analyzing various factors related to natural resources and land management. The downloaded data has variables associated with the spatial units, which in this case are counties in the U.S. Also when the data are downloaded there is an associated text file which contains all of the metadata for the Agriculture layer. This file can be used to determine what each variable label represents. The data for this layer were collected during the 2000 census.
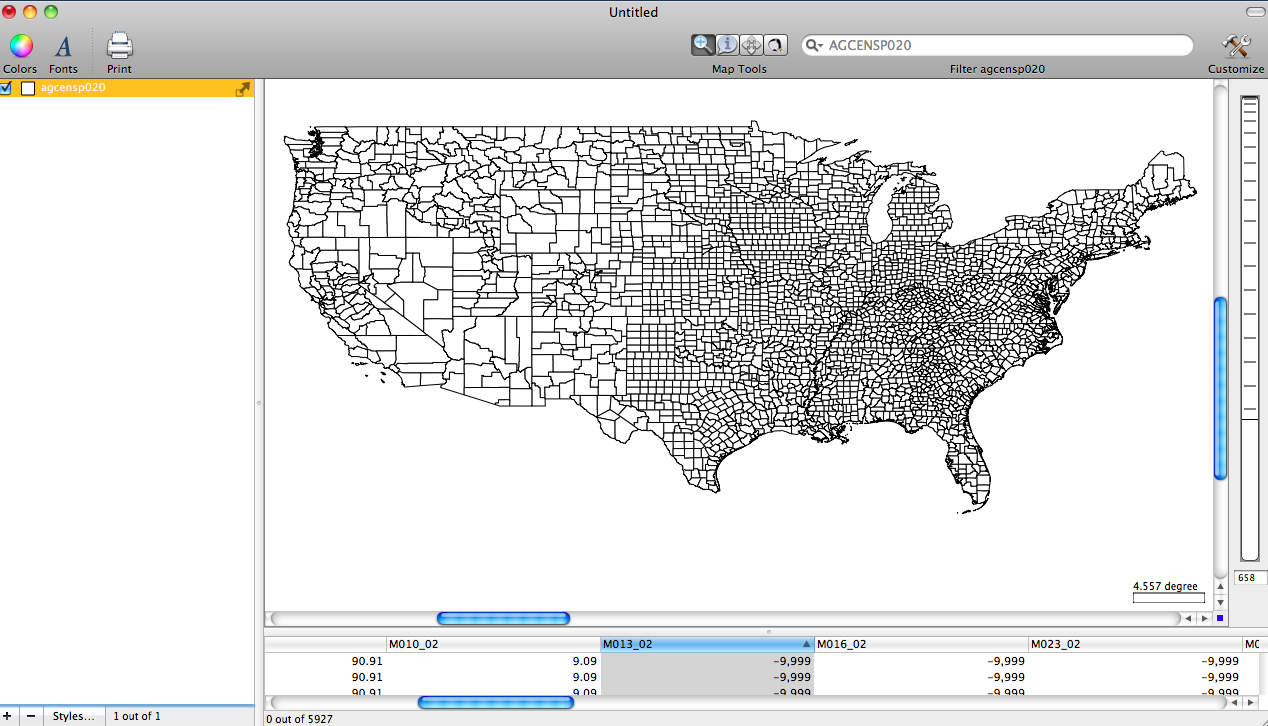
The first map shows downloaded layer without any information displayed
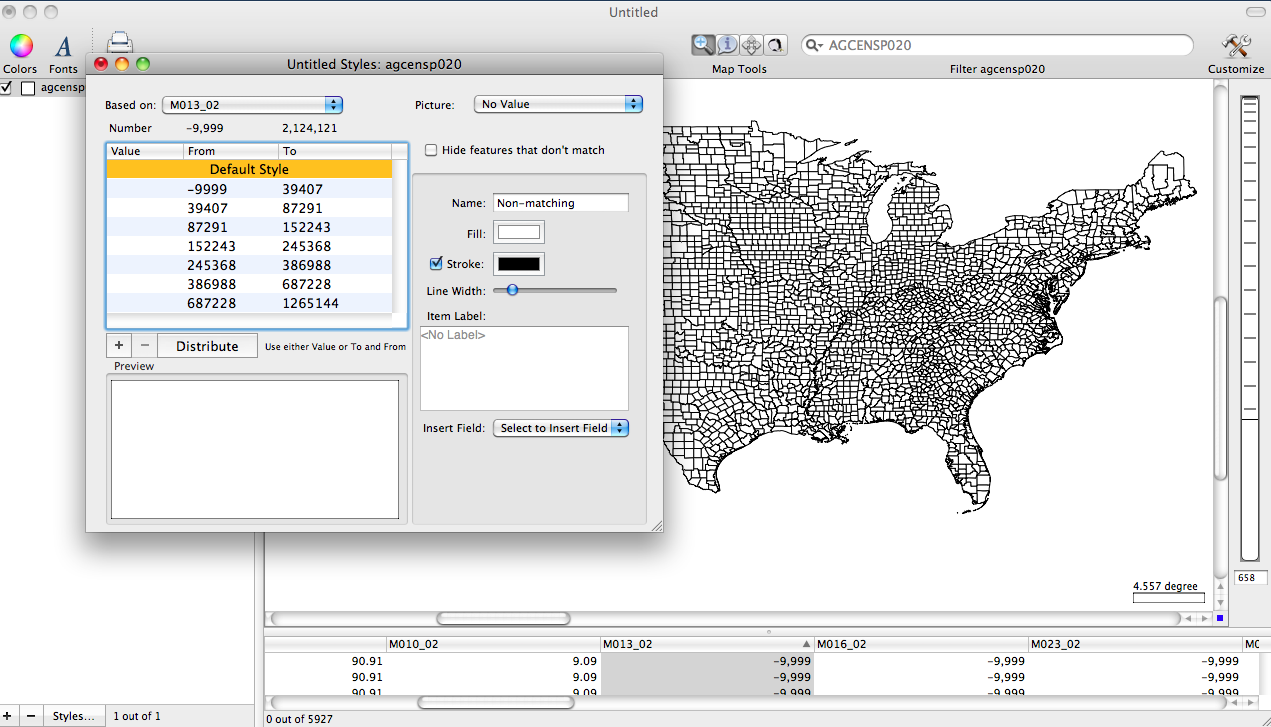
The second image shows the layer styles window using the variable M013_02, which is the average value of agricultural products sold per farm, in dollars. A value of zero may represent a zero data value or may mean that no data are available for the county, and -9999 indicates that data were withheld.
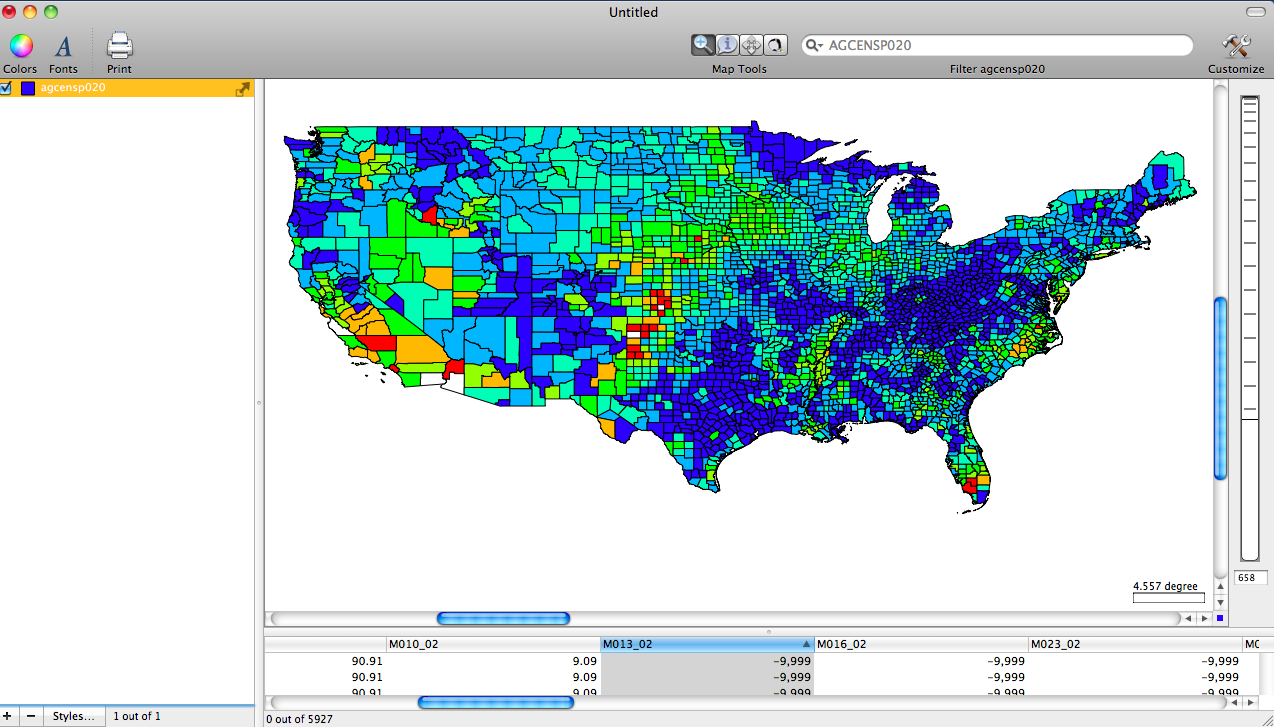
The third image shows the data being presented in Cartographica using a choropleth map.
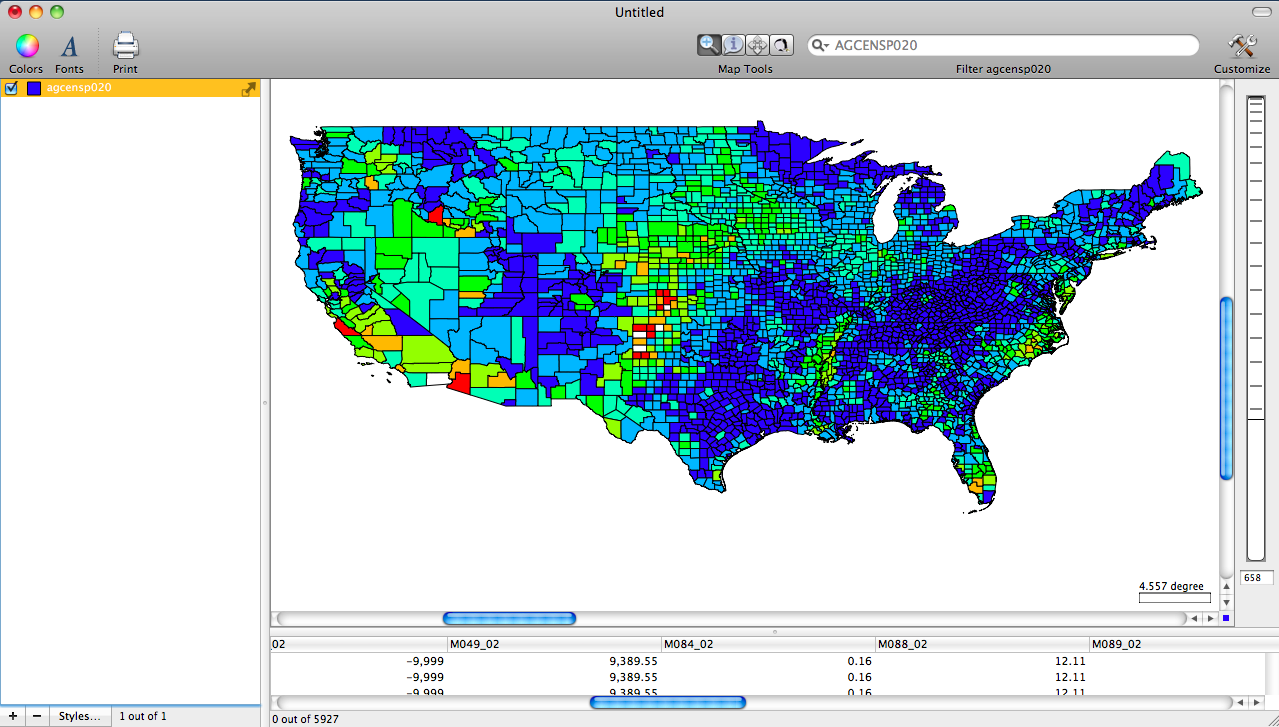
The fourth image shows the variable M049_02 displayed using a choropleth Map. This variable represents the average total farm production expenses per farm, in dollars. A value of zero may represent a zero data value or may mean that no data are available for the county, and -9999 indicate that data were withheld.
The final image shows The average number of cattle and calves per 100 acres of all land in farms. A value of zero may represent a zero data value or may mean that no data are available for the county. Notice in Image 5 that the legend is displayed.
