- Tue 22 June 2010
- Cartographica
- Rick Jones
The FBI's Uniform Crime Report provides statistics on the number of crime that are committed in American cities and counties. These data are archived at the Inter-University Consortium for Political and Social Research (ICPSR). The crimes known as Part 1crimes are typically composed of Murder, Rape , Robbery, Aggravated Assault, Assault, Burglary, Larceny, Auto Theft, Theft, and Arson. This post uses data collected from The National Atlas1 that includes information for a series of years 1994-2000.
The following maps show a series of five years to highlight which parts of the country have the most troubles with Homicide.
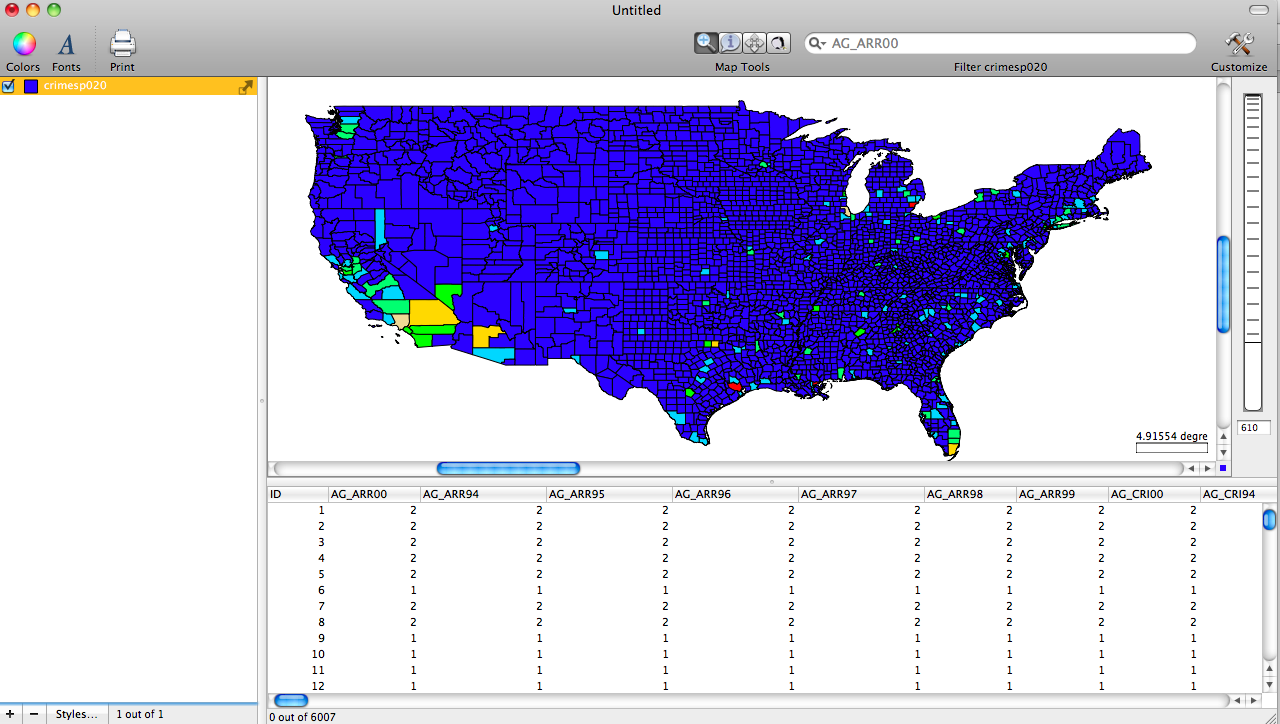
The first map shows the level of Homicide in 1994.
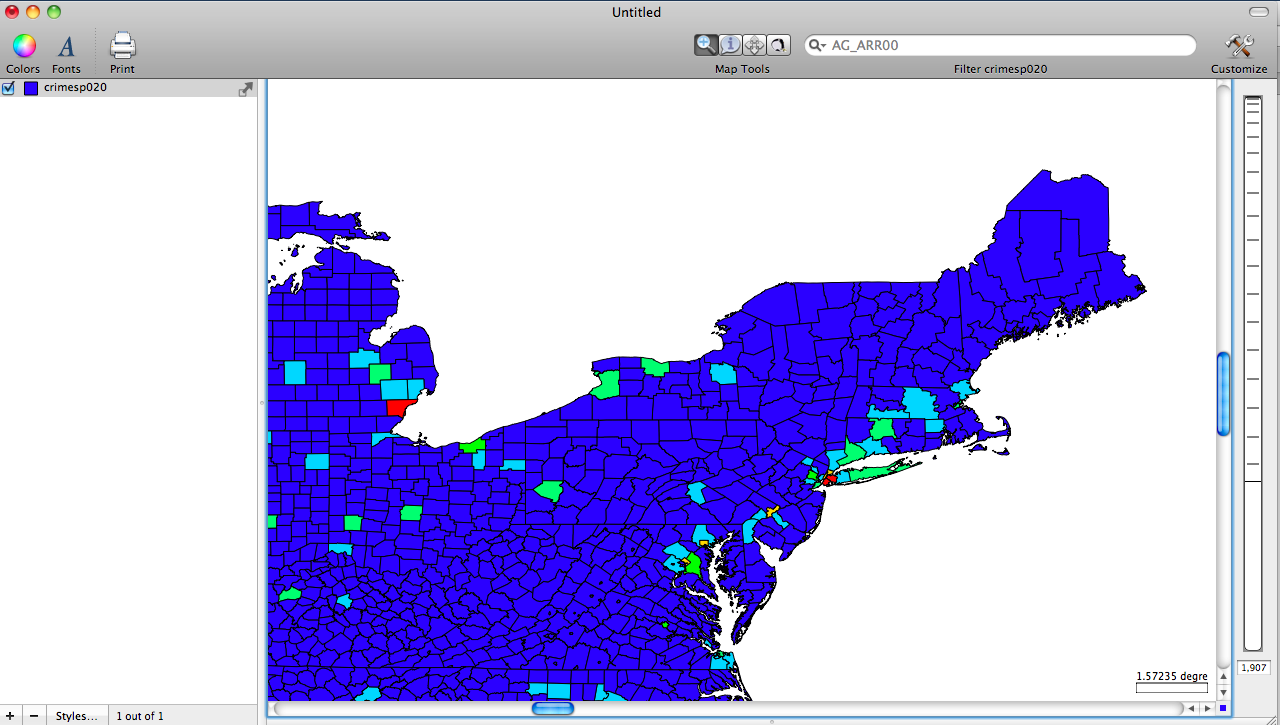
The second map shows a closer look at the NorthEast in 1994.
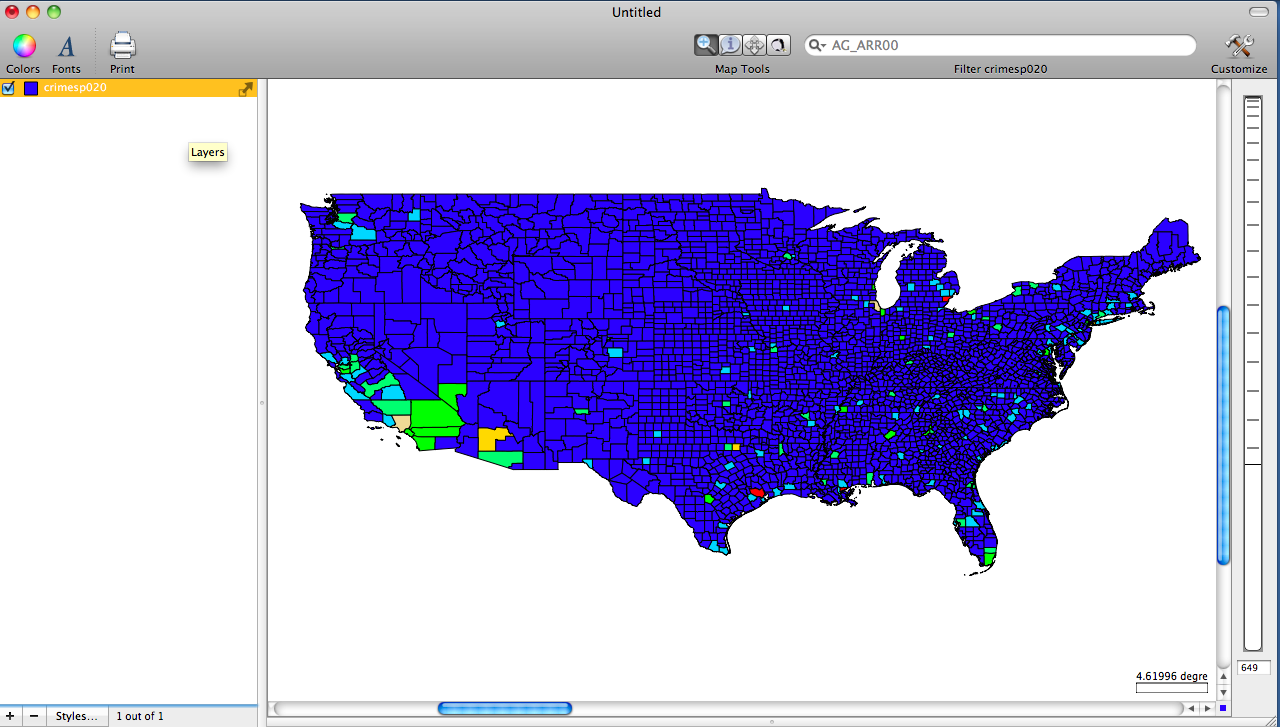
The third map shows levels of homicide in 1996.
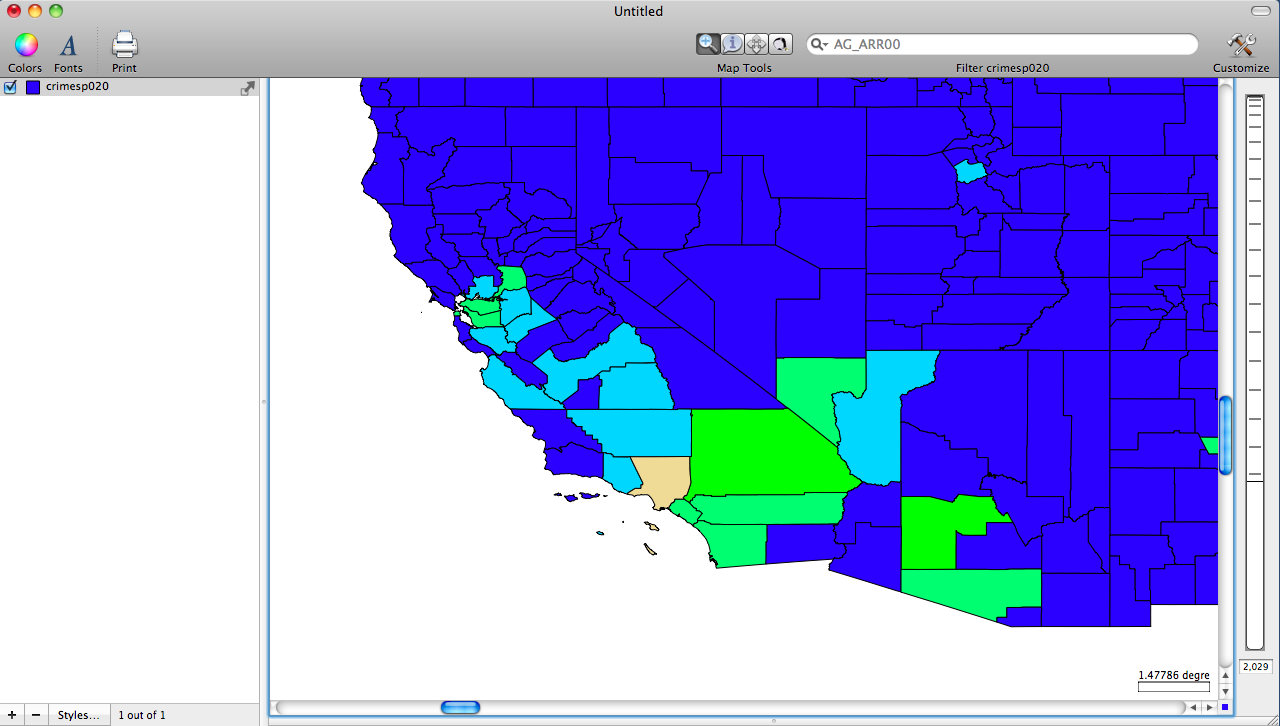
The fourth map shows homicides in the SouthWest in 1996.
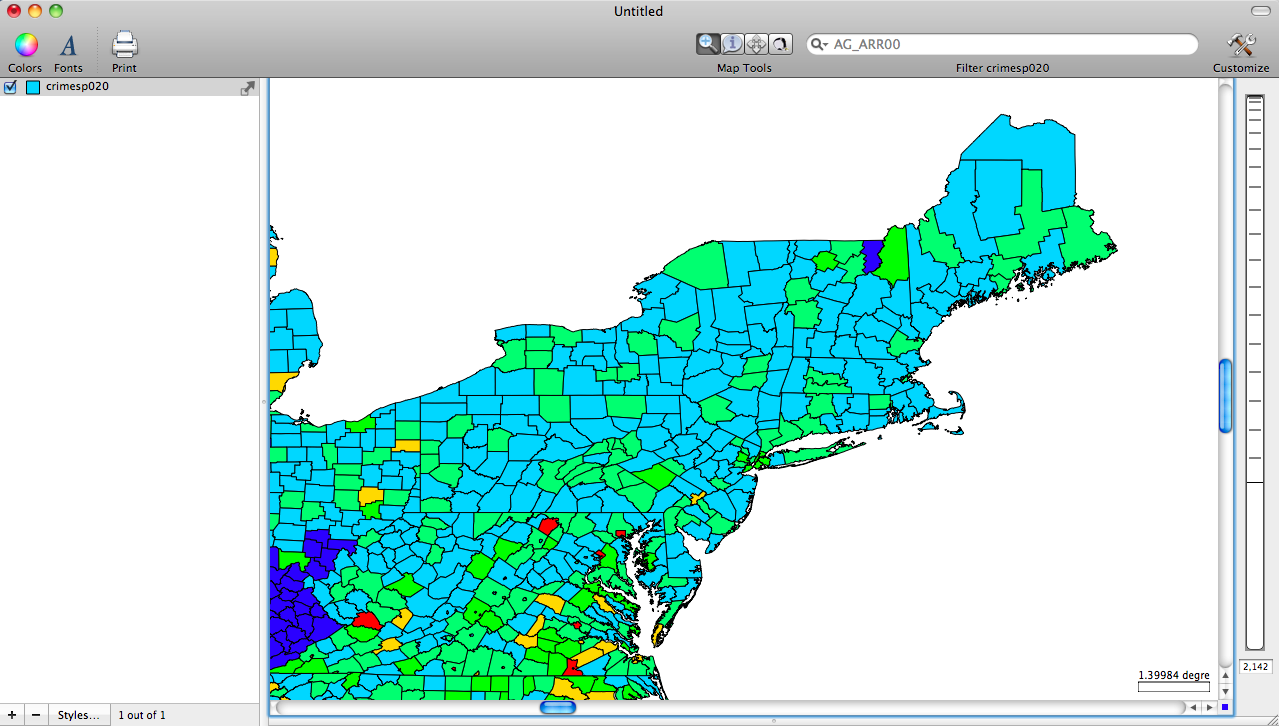
The last map shows homicides in the NorthEast that has been normalized by population size for the year 2000.
-
National Atlas program was halted, although some crime data is available through Crime Data Explorer on the FBI site, we haven't located similar data. ↩