- Wed 20 February 2013
- Cartographica
- Rick Jones
- #population, #health
The PEW Research Center recently released a report about the changing birth rate in the United States. According to the report, "The overall U.S. birth rate, which is the annual number of births per 1,000 women in the prime childbearing ages of 15 to 44, declined 8% from 2007 to 2010. The birth rate for U.S.-born women decreased 6% during these years, but the birth rate for foreign-born women plunged 14% — more than it had declined over the entire 1990-2007 period. The birth rate for Mexican immigrant women fell even more, by 23%." The report mentions that the full 2011 data are not yet available (it takes a long time to process all of the information and convert it to a format that is ready to be distributed to the public). In an attempt to enhance the information provided by the PEW Research Center we decided to create a small data set with the 2007 and 2010 birth rate per 100,000 population by state. We can calculate a change variable and then map the change by state using Cartographica. Download the birth rate data at the CDC Wonder website.
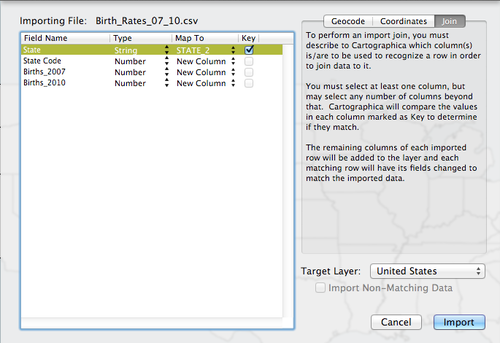
The first step in this process is to import a states file by choosing File > Import Vector Data. Download the states file at the U.S. Census Bureau website. The second step is to import and join the birth rate data by choosing File > Import Table Data. Use the following image to help set up the import process.
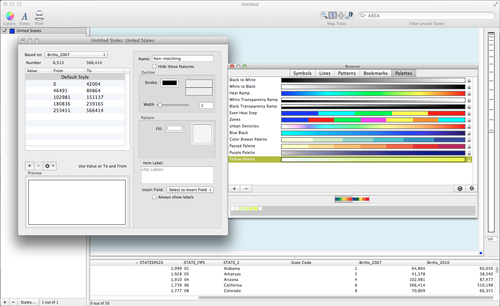
Use the Layer Styles Window to map the 2007 birth rate (Note: the birth rates are per 100,000 population). Change the Base On selection to Births_2007 and then click on the gear box and select Distribute with Natural Break (Jenks). Choose Window > Show Uber Browser and then select a color palette and then click and drag it to the table within the Layer Styles Window.
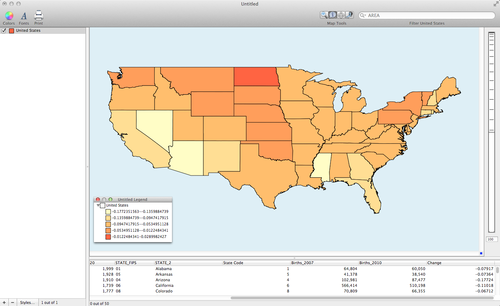
Map of the 2007 U.S. Birth rate by state.
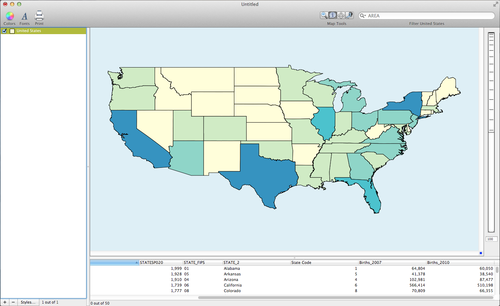
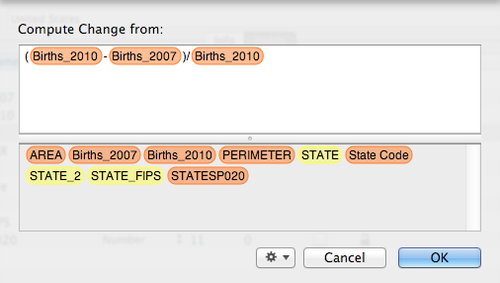
We want to map the change in birth rate by state between 2007 and 2010. To do this you need to calculate a change variable. You can do this using the Layer Info window. Choose Window > Show Layer Info. Click on the + button to add a new field and rename the field Change. Change the variable type to Number and change the precision to 5 and then finally click on Set Formula. Click and drag the Births_2010 variable first and then subtract the Births_2007 and place these in parentheses. Next, divide the subtraction by the Births_2010 variable. This will calculate the percent change between 2007 and 2010.
Percent change in birth rate between 2007 and 2010.