- Thu 23 February 2012
- Cartographica
- Rick Jones
- #georeference, #nuclear, #raster
In recent weeks there has been talk about the increasing risk of Iran's nuclear program promoting potential for Israeli preemptive attacks. I wanted to use this post for dual purposes. First, I had a general curiosity about the location of Iranian nuclear facilities so I thought I would try to find a reliable source of information to create a few maps highlighting the locations of these facilities. The best source that I found in my short period of research was from a document created by the Congressional Research Service at the Library of Congress. In the report written by Hussein D. Hassan, the locations and descriptions of the nuclear facilities are provided. See the document Here. On page 5 of the document there is a map showing the locations of the Iranian nuclear facilities. Note that the map was created by the International Atomic Energy Agency and that the locations are approximate. Second, I wanted to use the process of georeferencing to show Cartographica's ability to work with raster data, and while doing so, point out the importance focusing on local area georeferencing accuracy to ensure that points nearby are as accurate as possible. I will explain this in better detail below.
With publicly available information like the Iran Map we can use what's provided to create point maps that we can then use for our own purposes. The best method for creating a raster file out of a map like the one provided in the document above is to simply take a screenshot of the map. To take a screenshot on a Mac hold down Shift, the apple button, and the number 4. This will bring up crosshairs that allow you to take a screenshot.
Prior to importing the raster file, add a basemap by choosing File > Add Live Map. This will give us reference points for georeferencing the Iran map raster file. Once the Live Map is added import the Iran map raster file into Cartographica by choosing File > Import Raster Data.
When the map is first imported into Cartographica it will have a yellow triangle next to it in the Layer Stack. This indicates that there is not currently a Coordinate Reference System assigned to the map. Click on the triangle in the Layer Stack. This will bring up a small window. Click Set CRS. This will bring up another window that allows you to choose the coordinate reference system. Choose WGS 84/Pseudo-Mercator and then click Set.
Next, you will notice that the Iran map image is upside down. Further, if you choose Layer and then uncheck Include in Map Extent you will see that the image is a very small dot in the center of the map. Its barely noticeable just off the West Coast of Africa. Obviously, this is not the location of Iran nor is Iran upside-down.
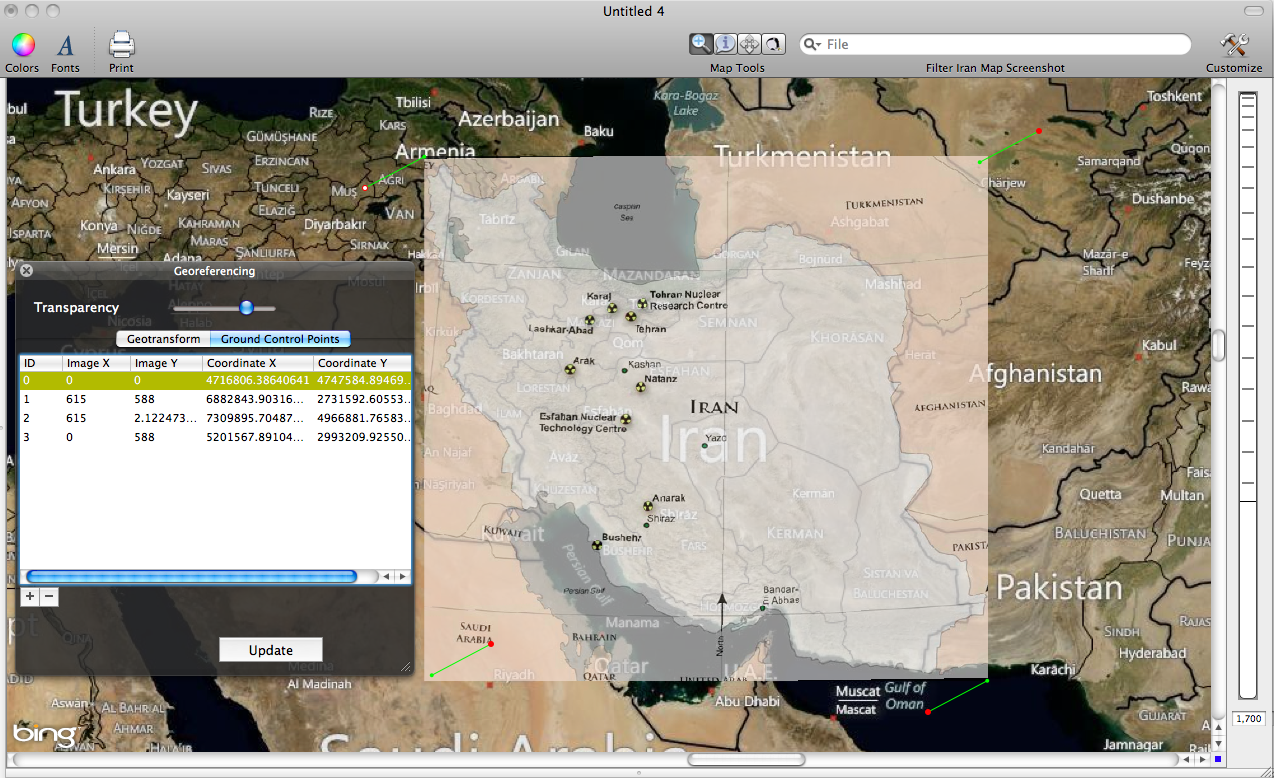
To fix this we can georeference the image. First, use the zoom tool to zoom in to Iran. Try to make Iran's borders at the full extent of the map (a close zoom).
Next, select the Iran map layer in the Layer Stack and then choose Edit > Georeference Image. This will bring up the Georeference Image window. First, click Fit Display. This will automatically move the Iran Map image that was originally a small speck in the Atlantic Ocean to approximately the right location and the right size. The image will still be upside down so then click Flip Vertical. Now the image is nearly in place. We can change the layer transparency so that we can see the underlying Live Map. This will give us points of reference to help us more precisely place the Iran map. Use the Transparency slider at the top of the Georeference Image window. There is not a recommended level for setting the transparency. As long as you can distinguish between the Iran Raster map and the underlying Live Map you should be good to go.
Next, we are going to more precisely match up the Iran map to the Live Map by moving ground control points. There is an important issue involved in matching the Iran image to the Live Map. The Live Map is projected in a Pseudo-Mercator projection (common for most web-based maps), resulting in a squared-up map with latitude and longitude (or right angles) that increase distortion in object scale, distance, area, and shape. If you look closely at the Iran map you can see that there are latitude and longitude lines overlaid on the map. The lines are curved, this is an indication that the Iran map was projected differently from the Pseudo-Mercator projection used by the live map. For this reason the Iran map and the Live Map will not perfectly match up without distorting one image or the other; even with the most tedious adjustment of the ground control points. However, we can work around this problem to still create a fairly accurate map of the locations of Iran's nuclear facilities.
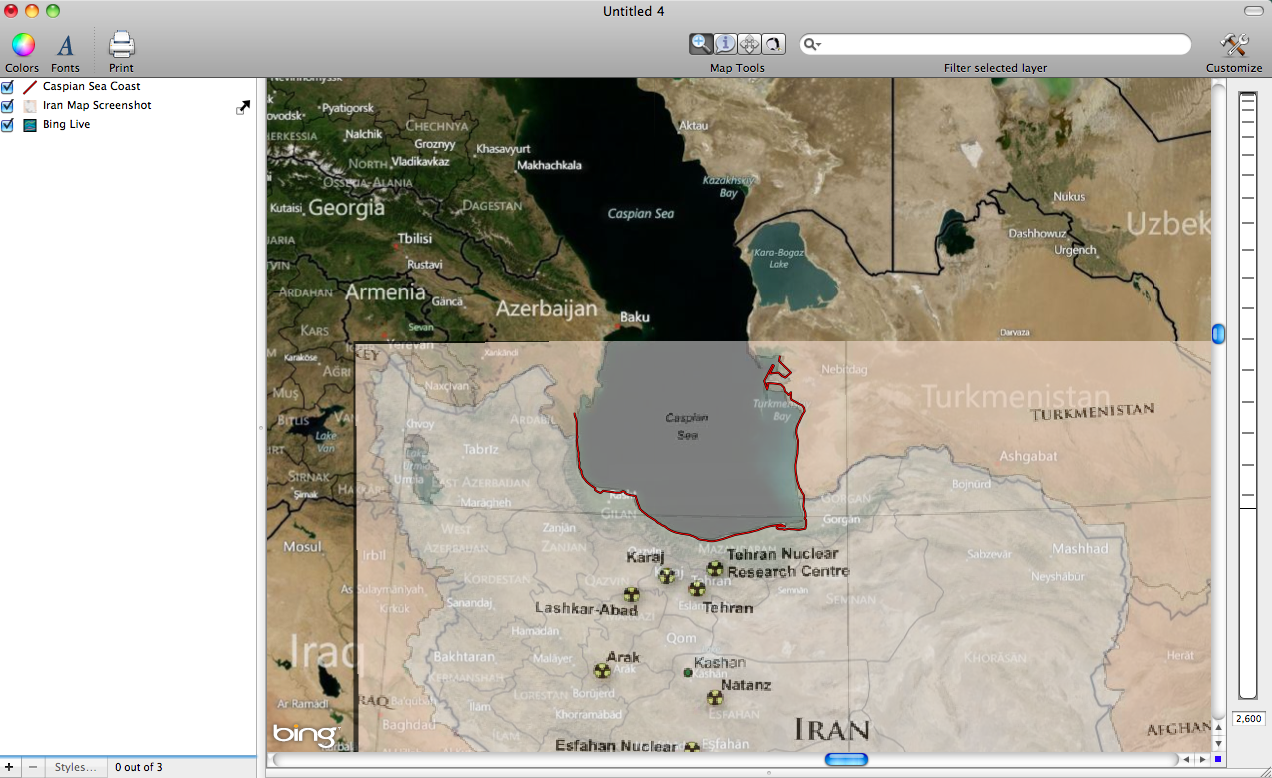
The way around the problem is to focus on specific areas of the map while creating our points. For example, notice on the Iran map there are nuclear facilities in the Norther section of the country (near the Caspian Sea) and there are also nuclear facilities in the more Southern section of the country near the Persian Gulf. To ensure that the difference in the Iran map and the Live map are not causing major problems with the creation of our points we can use nearby reference points to be sure that specific areas of the country are accurately placed. The main problem is that Iran is a large country, which means that there is more distortion in map when looking at the Northern section vs Southern section. See the image below for an example.
To create points that are more accurately placed, we can use geographic features to position individual sections of the Iran map. As an example, I am going to focus on the points near the Caspian Sea. In order to ensure that the points are accurate, I am going to very carefully match the Iran map to the Live Map along the coast of the Caspian Sea. To better highlight the Caspian Sea coastline I created a new layer by clicking on the "+" button at the bottom of the layer stack. Click on the new layer in the Layer Stack then choose Edit > Add Feature and choose Line when prompted for the feature type. Then zoom in to the Caspian Sea Coastline and carefully create a line that follows it by holding down the option button and then placing points along the coast. This will gives us a good reference to compare the Iran map to. Looking at the image below it can be seen that there is a good match along the Caspian Sea coast once the ground control points are adjusted, which indicates that the nuclear facility points should be approximately in the correct location.
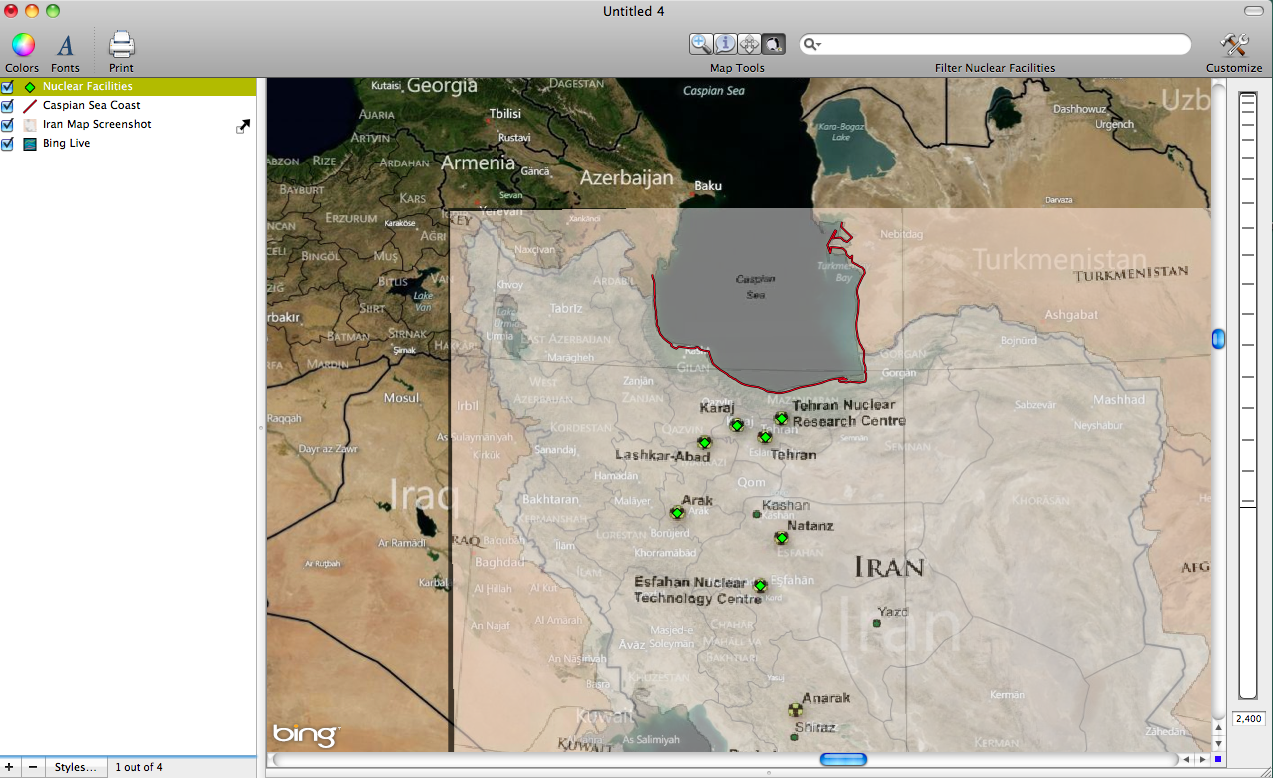
Once you are satisfied with the placement of the Iran map you can begin creating your own point layer for the individual nuclear facilities. Click on the + button at the bottom of the Layer Stack to add a new layer. Then click on the new layer in the Layer Stack then choose Edit > Add Feature and choose Point when prompted for the feature type. Then place points on the nuclear facility locations to add the points to the new layer. To add the points hold down the option button and then click where you would like to place each point. Chose to put the potions on the facilities in the Northern Section of the country as the more Southern locations will likely be distorted. See the image below for the first set of points.
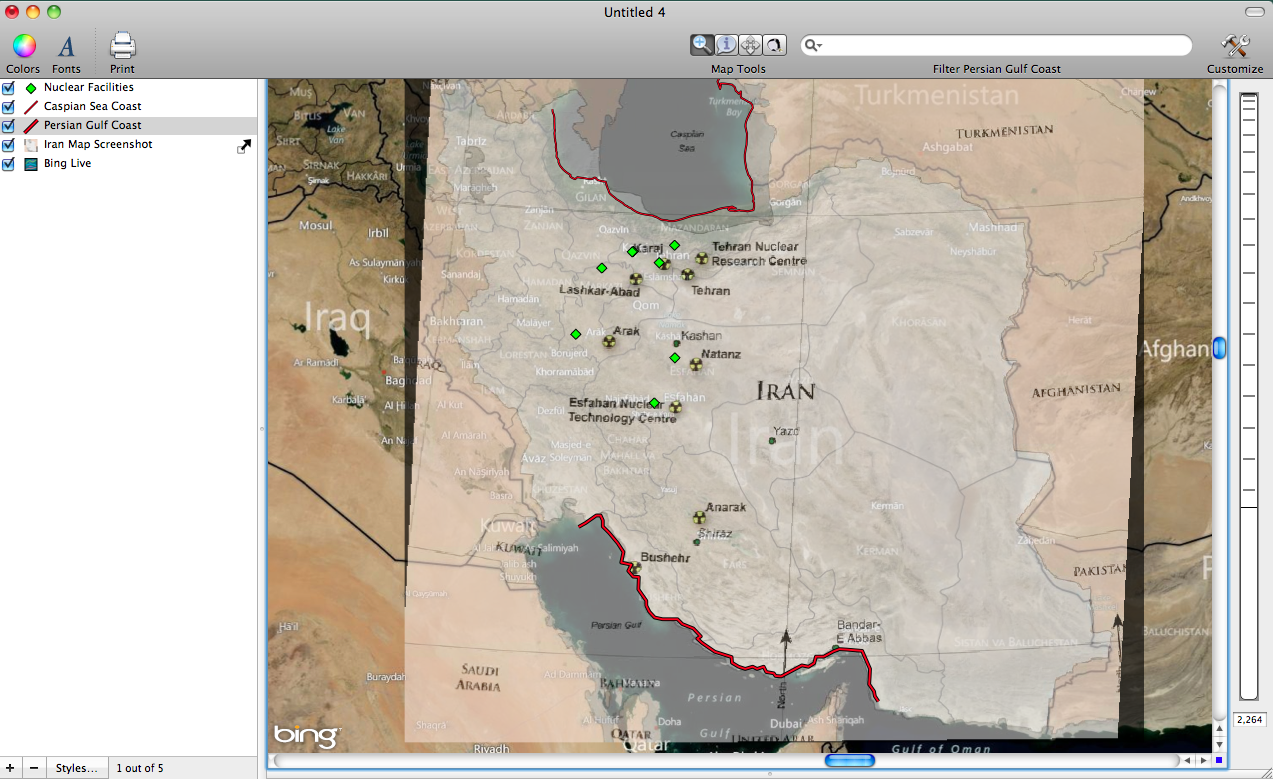
Next, we can repeat the process from above, this time using the Persian Gulf coastline as the reference point. This will require readjusting the ground control points. Notice that in the first image below there is a lot of distortion now at the the top of the map near the Caspian Sea, but the distortion along the Persian Gulf is now correct. This means that this points near the Persian Gulf coastline can now be more accurately placed. Using the same steps as above add new points to the Nuclear Facilities point layer that we created previously. The final image shows the Iranian Nuclear facilities point map on top of the Live Map.
Final result:
