- Fri 16 November 2012
- Cartographica
- Rick Jones
- #Cartographica, #analysis, #vector
Cartographica 1.4 now has the ability to perform Cluster Analysis. Cluster Analysis involves choosing and setting a number of parameters that are used to identify "hot spot" locations of point level data. Clusters are areas that have high concentrations of a particular incident. Knowing where high concentrations of certain things are located can be a very valuable tool for analysts conducting spatial analysis.
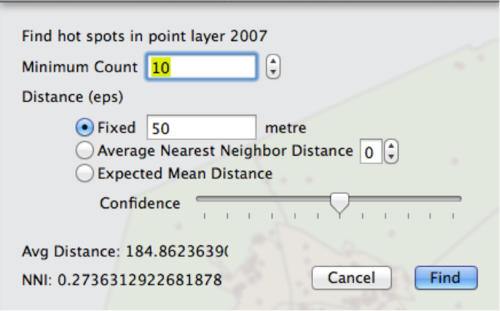
The two main parameters used to identify clusters are Minimum Count and Distance. Minimum Count allows you to determine how many points are needed to identify a cluster. For example, if the minimum count is set to 5 then no cluster that is identified will have fewer than five points. The Distance parameter is used to determine a search distance between points to identify nearby neighbors that are a part of clusters. Only points that meet the criteria in the parameters are used for the Cluster Analysis. The image below shows the default setting for the Cluster Analysis window.
The Distance parameter has several options available.The Fixed Distance method will only identify point clusters that fit the Minimum Count criteria and are within a specified 'fixed' distance to other points. This is useful for comparing different types of points using the same criteria. For example, you might want to compare hot spots of Assaults and Robberies. However, the disadvantage of the Fixed Distance method is that the distance is arbitrary and is up to the user to decide. The Average Nearest Neighbor method identifies point clusters that meet the Minimum Count criteria and that have an average distance between neighbors that is greater than a threshold distance. The threshold distance is based on a K-order distance distribution. Where K is the number of nearest neighbors used to construct the distance distribution. A higher K-order will result in a distance distribution with a higher average distance between points, which will result in an output with a larger hot spot area. The Expected Mean Distance identifies points that fit the Minimum Count criteria and are within a randomly defined threshold distance. The confidence interval is used to set a probability that a pair of any two points are within the threshold distance. A confidence interval of 50% means that 50% of point pairs will not be within the threshold distance if the distribution of the points is spatially random. The confidence levels are specified by using the slide bar. The positions on the slide bar correspond to the following confidence levels.
| Slide Bar Position | Probability |
|---|---|
| 1 | 0.00001 |
| 2 | 0.0001 |
| 3 | 0.001 |
| 4 | 0.01 |
| 5 | 0.05 |
| 6 | 0.1 |
| 7 | 0.5 |
| 8 | 0.75 |
| 9 | 0.9 |
| 10 | 0.95 |
| 11 | 0.99 |
| 12 | 0.999 |
See the example below to see how Cluster Analysis operates using Cartographica.
DC Crime Analyst
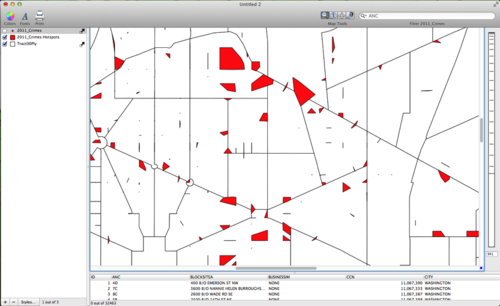
As a crime analyst in Washington D.C. you are interested in knowing where crime clusters are located within the city. Identifying clusters helps you inform police officials about where to allocate additional resources to prevent crime. To identify crime clusters you need to analyze point level crime incident data.
The crime data and basemap used in the example are available at DC_GIS. Import the data by choosing File > Import Vector Data.
To create a cluster map choose Tools > Find Clusters. Here you have to decide what the parameters of your Cluster Analysis will be. A classic problem in Cluster Analysis is determining how the parameters will be selected. In essence, the user gets to decide how the clusters are defined. While the clusters themselves are based on the locations of the data, the values of the parameters that define the Clusters are infinite. Therefore, the user needs to have good reason to set the parameters at specific levels. For a crime analyst, clusters should be sized based on the capabilities, resources, and methods available to address the problem. Clusters that are excessively large are too broad for crime prevention efforts to be effective, and clusters that are too small may be too restricted for police to respond effectively. The goal of Cluster Analysis and identifying and setting parameters is to create an output that allows the analyst to show locations where crime is a problem. In many cases this may mean that you need to experiment with the parameters in order to produce an output that helps you achieve your goals.
To create the map shown below the following parameters were used. The Minimum Count was set to 10. The Distance parameter selected was Average Nearest Neighbor and the value was set to 5.
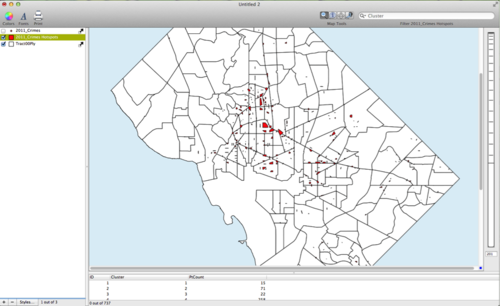
The second image is a closer look at the clusters in Central D.C. Notice that many of the clusters are several blocks large and would be good for focusing crime deterrents that are effective for entire areas such a vehicle patrol. However, the image also shows many clusters that are quite small and that may require more localized attention from the police.