- Tue 18 May 2010
- Tips and Tricks
- Rick Jones
New to Cartographica 1.2 is the ability to compute columns in a data set (this includes adding computed columns to WFS layers!). Computed columns give users the ability to quickly create new variables that incorporate information from other data fields in the same data set. This allows users to quickly create rates, ratios, and proportions by using a simple drag and drop method. Cartographica currently supports a large number of basic math and geometric functions.
See Below for the Step to Create Computed Columns
The example below will calculate the number of retail sites per 1000 residents in Block Groups in Washington D.C.
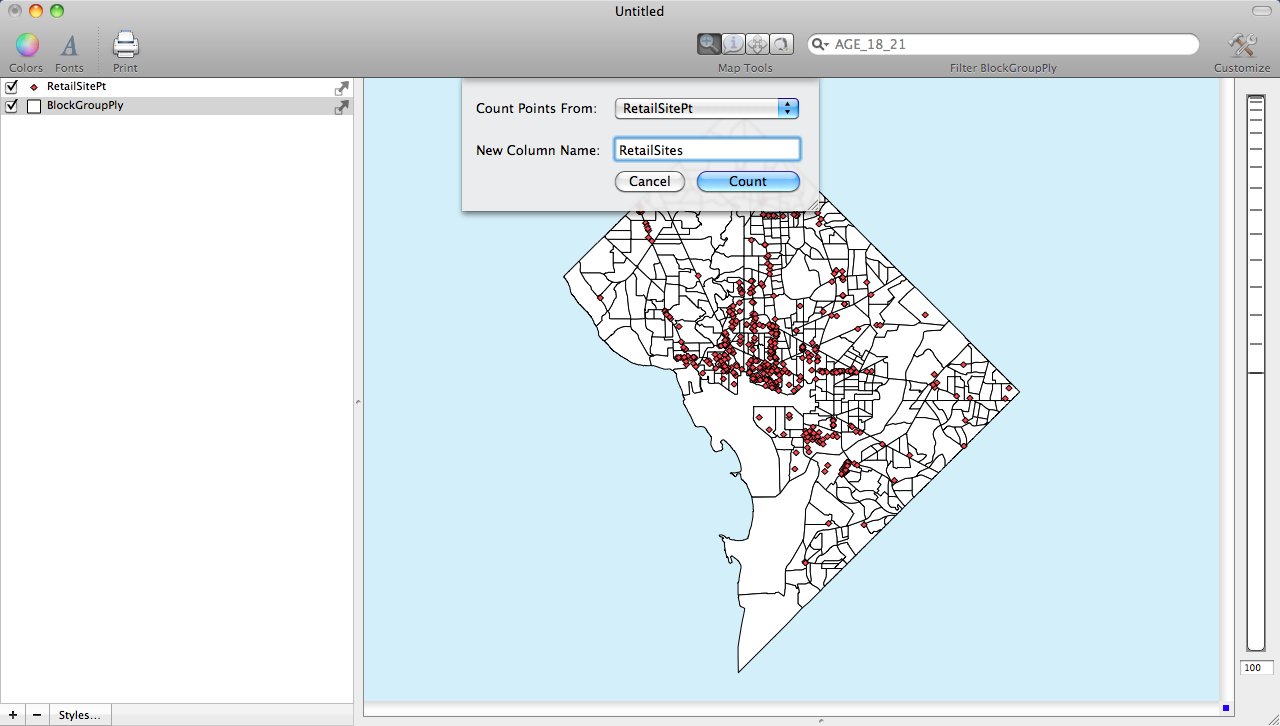
- The first step is to count the number of retail sites that are in each block group. To do this, select the block group layer in the layer stack, then select Count Points in Polygons from the Tools menu. This function will aggregate the number of retail sites to each block group so that comparisons can be made between the different areas around the city
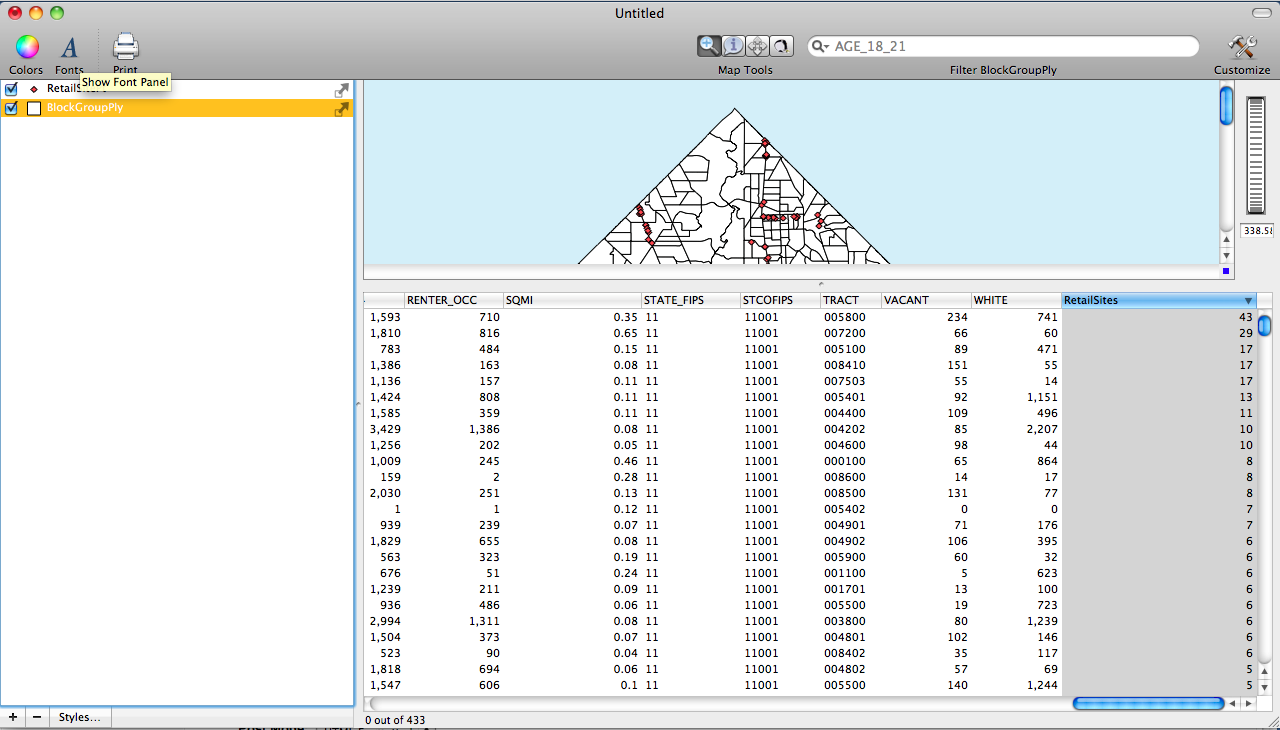
- After the points are counted a new column will be added the dataset. The newly created "Retail Sites" column is shown below with the counted number of retail sites per block group.
-
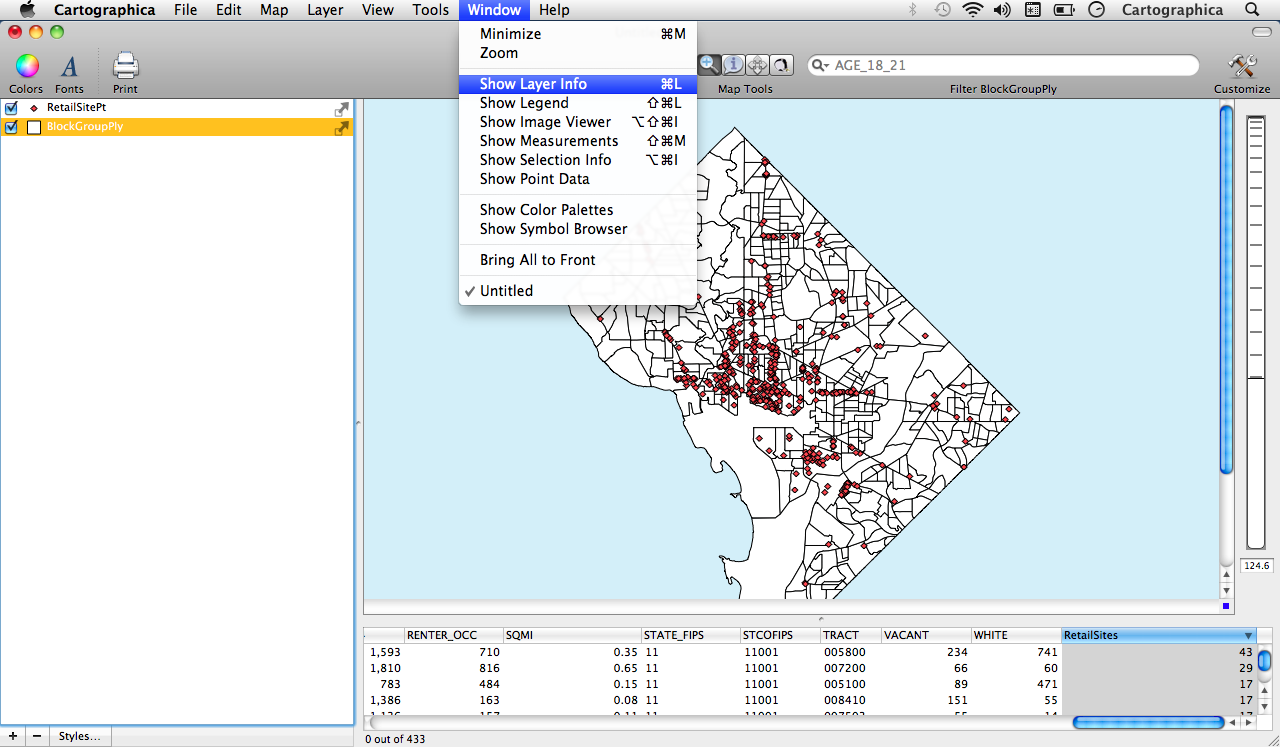
Next, choose Show Layer Info from the Windows menu. This will bring up the Layer Info Window which allows you to add new columns to the layer by clicking the "+" sign. Once a new column is added, you can calculate the information for the new column by including data from other fields. In this case we are going to include the new field we created, "Retail Sites", and we are going to include "POP2000", which is the population of each block group during the year 2000 census.\
-
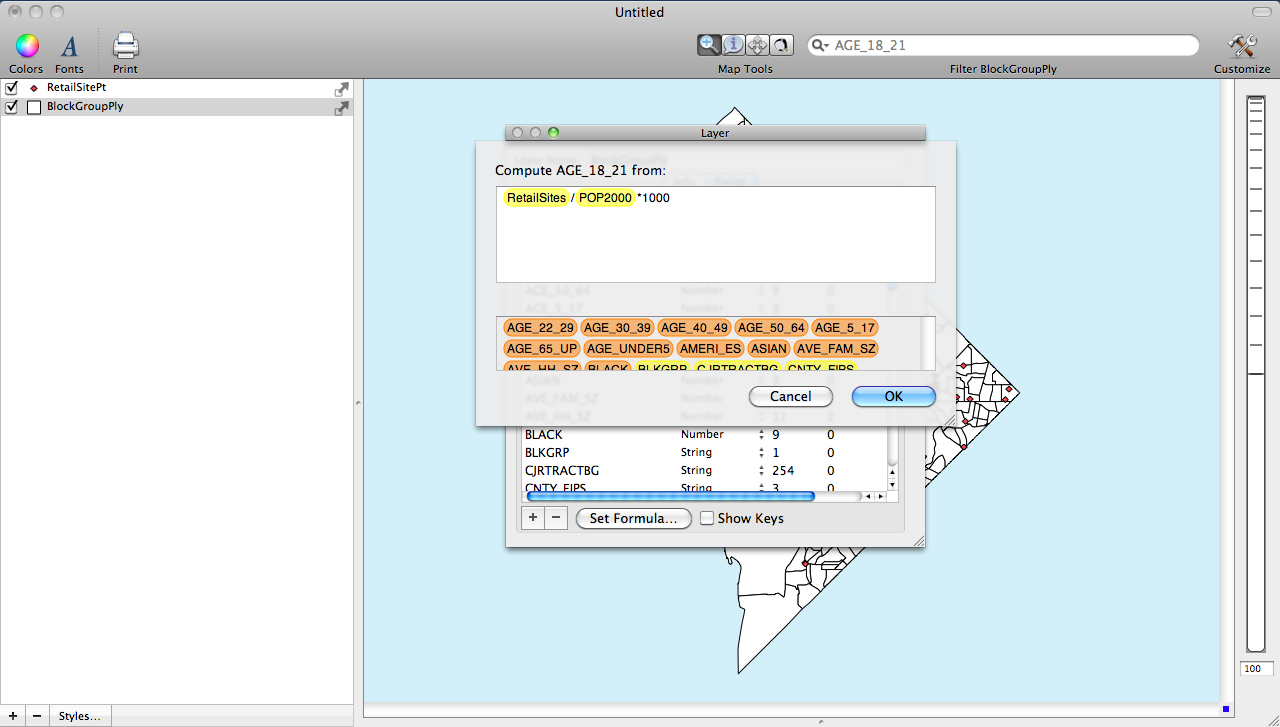
Next, we need to set the formula to calculate the rate for the number of retail sites per 1000 residents. From the Layer Info window, with the new column selected, click Set Formula..., drag the appropriate data into the window on the top side of the Set Formula sheet and include the appropriate math functions. In order to calculate a rate we are going to divide the number of retail sites ("Retail Sites") by the block group population ("POP2000") to get the proportion of retail sites per resident, and then we are going to multiply the outcome by 1000 to get the number of retail sites per 1000 residents.
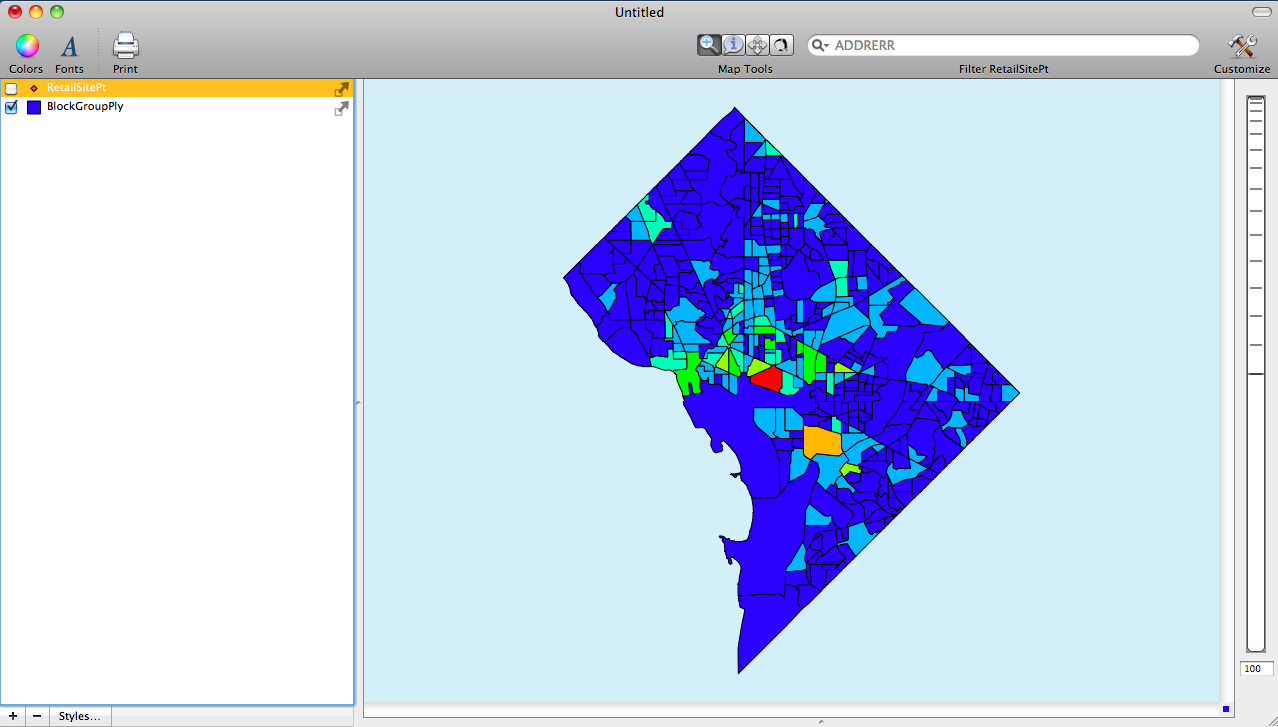
- Finally, we can change the map so that it displays this information. The example map shown here was created by following steps found in our article Choropleth Mapping.