- Wed 06 February 2013
- Cartographica
- Rick Jones
- #Add Features, #DEM, #Spatial Join
An owner of a golf course is working on redeveloping his golf course and has hired an analyst to help with the process. To make the process more streamlined and efficient the analyst is using GIS to help identify and plan various aspects of his new project. As part of the project the analyst needs elevation data for the greens on the golf course. He wants to know the elevations of the greens so that he can determine the best way to add new approaches and shots. Cartographica can help in this process by using Digital Elevation Models. To obtain the elevation data the analyst went to the Kentucky Digital Elevation Model Download Center. On this website the owner downloaded the K42 DEM.
After downloading the DEM import the file into Cartographica by choosing File > Import Raster Data. Once the DEM is imported into Cartographica you can create a contour map that will provide the needed elevation data.
To create a contour map:
-
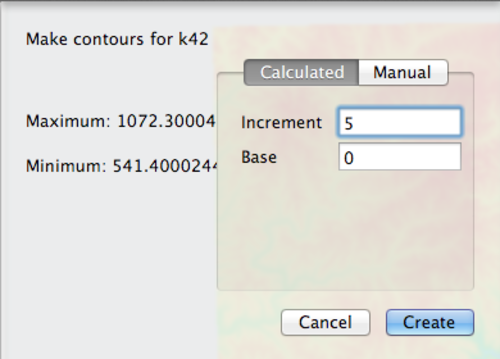
Choose Tool > Create Contours
-
Set the increment value to 5
-
In the case we want highly accurate elevation data so we will use a small increment, so set the base value to 0.
-
Next, we need to create a layer showing the location of the greens on the golf course. To do this we can use satellite imagery and the Add Feature tool. Choose File > Add Live Map.
-
Select the Bing Map layer in the Layer Stack and the choose Layer > Include in Map Extent.
-
Uncheck the K42 layer in the Layer Stack.
-
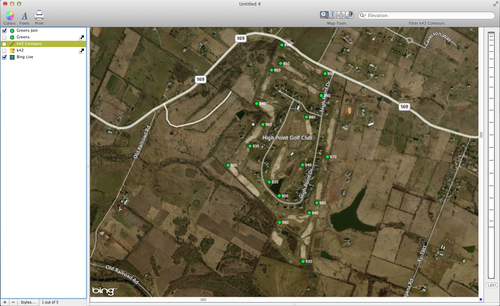
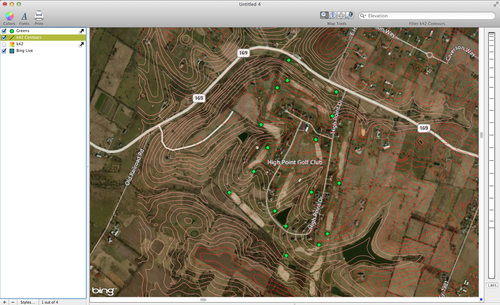
Zoom in to the Lower Left Corner of the Contours layer and look for High Point Golf Club. Once you find the golf course uncheck the contours layer.
-
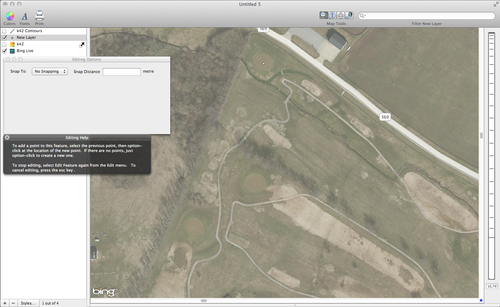
Choose Layer > New Layer and then Edit > Add Feature. Select to Add a point layer and then add points on top of the greens.
See below for an example of the add points process.
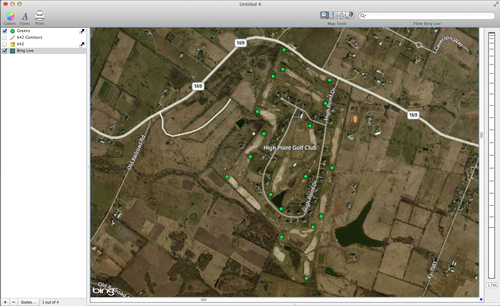
See below for an image of the full set of points.
-
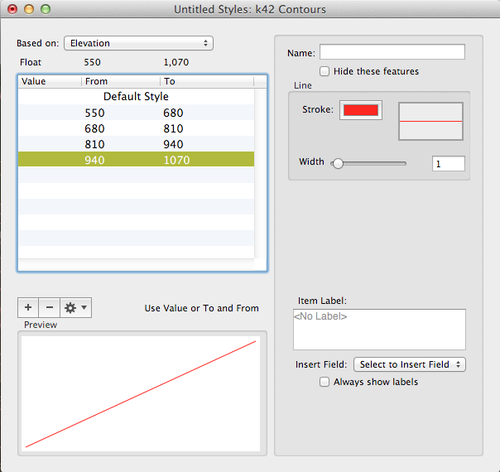
We can highlight the general elevations of in the area by showing color differences for the various elevations. Double-click on the contours layer in the Layer Stack to bring up the Layer Styles Window.
-
Change the
Based Onselection to Elevation. -
Add four categories by clicking on the
+button four times. -
Choose Window > Show Uber Browser and then click on the palettes tab.
-
Select a palette and while holding down the option key, click and drag it to the table in the Layer Styles Window.
See below for images of the Layer Styles Window and the Contours.
And with the contour lines added.
-
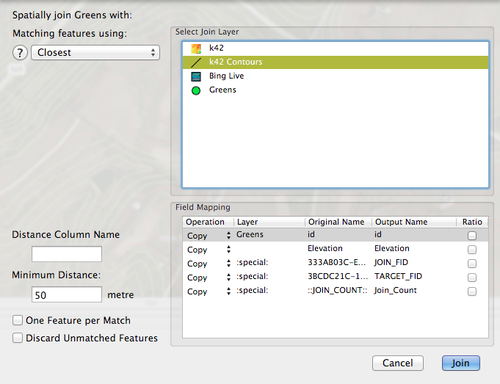
Finally, we can perform a spatial join to join the elevation data from the contours layer with the greens points layer. This join will add a new column to the greens points that contains the elevation data so that the analyst can determine the elevations for each of the greens. To perform the spatial join choose Tools > Spatial Join.
-
Select the
Closestoption and type in 50 meters in the distance box. The distance value is used to specify a search radius for the Closest operation, which will select the nearest feature in the Contours layer and use it as the feature to be joined. The Closest operation is preferred over the Within Distance operation in this context because the Within Distance operation will find all matches and then randomly select a value where as the Closest operation will only find the nearest feature. -
Uncheck the discard unmatched features box. See Below for an image of the spatial join window.
-
Finally, using the Layer Styles Window you can show the elevations of each of the points using the Item Labels. See below for the final image.