- Mon 23 January 2012
- Cartographica
- Rick Jones
This post describes the process for collecting data using the new U.S. Census American Fact Finder website (Fact Finder2). The new website allows you to select data from almost all U.S. Census Bureau surveys. These include the Decennial U.S. Census and American Community Survey among many others. The new data collection process requires you to use a series of steps for collecting what you want. These steps are logical as you move from general to specific selections. To start, you first determine the dataset and year that you would like to use. Then you choose the geographic level (i.e. national, state, county, cities, etc.), and finally you select the specific variables that you want for each geographic unit. As you make selections the Your Selections box in the top left of the Fact Finder2 webpage will update. This is a new feature of Fact Finder2 that helps you manage what you have selected. As we move through the steps pay close attention to the Your Selections box to be sure that you are collecting exactly what you want. The new Fact Finder2 is now the only way to collect data. Previously, the American Fact Finder website operated differently and contained less data. The new American Fact Finder is more efficient and allows for quick data allocation. Note: Be sure to use Firefox when using the American Fact Finder 2 website.
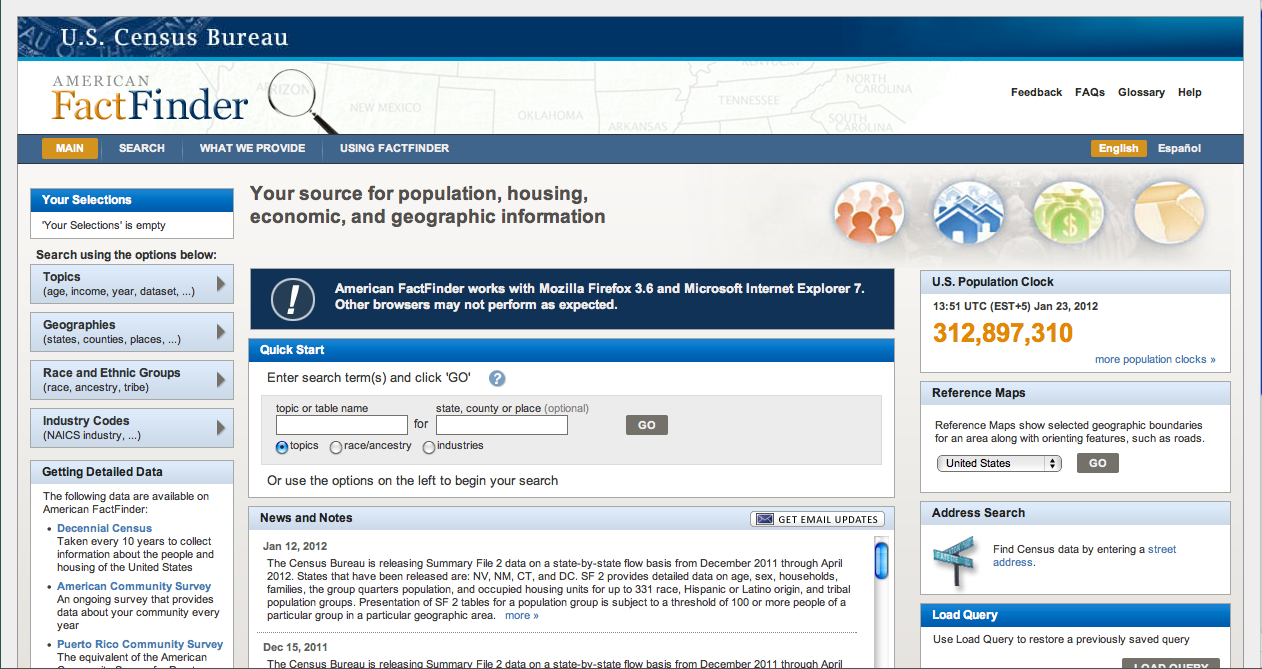
First, go to the American Fact Finder website.
Here is a screenshot of the Fact Finder2 webpage.
Step 1: Selecting Your Dataset
To begin the data collection you need to first choose a dataset to collect data from. On the left side of the webpage there is a tab titled Topics. The Topics tab is where you can set a number of search parameters for your data collection. Under Topics you can choose to limit the search by Dataset, Year, or by more subject based criteria like People, Housing, and Business and Industry. The Product Type selection under the Topic tab allows you to choose whether to get a full data set, a simple table, data comparison tables, and many other types of products. For the purposes of this example we are going to focus our attention on the Dataset option.
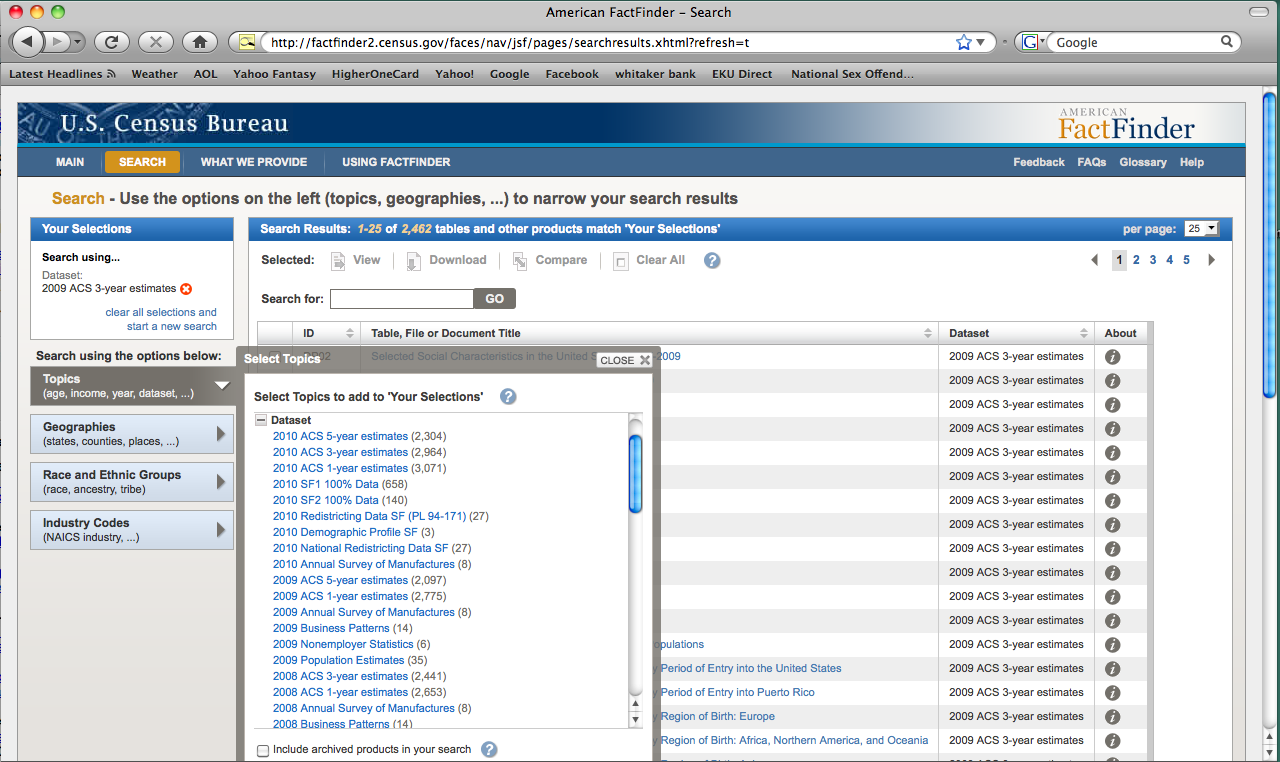
Steps for Choosing a Dataset
Under the Topics tab, Click on the + sign next to the Dataset option. Click on the 2009 ACS 3-year estimates option (Note: Be sure to click on the Dataset, don't check the box!). This will give you the 2009 American Community Survey 3 year estimates dataset. After you select the data set you should see the dataset listed under the Your Selections box in the top left of the webpage. After you select the dataset close the Select Dataset window.
Step 2: Choosing Geographies
Now that you have selected the dataset you need to choose the level of geography that you want to use. On the left side of the webpage, under the Topics tab, is the Geographies tab. This is the location where you can limit you selection by geography.
Steps for Choosing Geographies
Under the Geographies tab, in Search Bar type All Counties Within South Carolina and click Go. Click on the All Counties within South Carolina selection in the Geography Results Window. It should be the first option. After you select the All Counties file it should appear in your Your Selections box. Once you choose the geography close the Select Geographies window.
Step 3: Selecting Data
Next, we want to collect demographic and social data for each county within South Carolina. The variables that are available based on our dataset and geographic selections are now shown in the Search Results panel. To find the variables that you want you can scroll through the pages to and check the boxes for each variable, or you can use the Search bar. Using the Search bar is most efficient if you know what variables you want. We will use the Search bar to limit our selection to make finding the variables we want easier in this example. In the new version of American Fact Finder it is easiest to download variables one at a time.
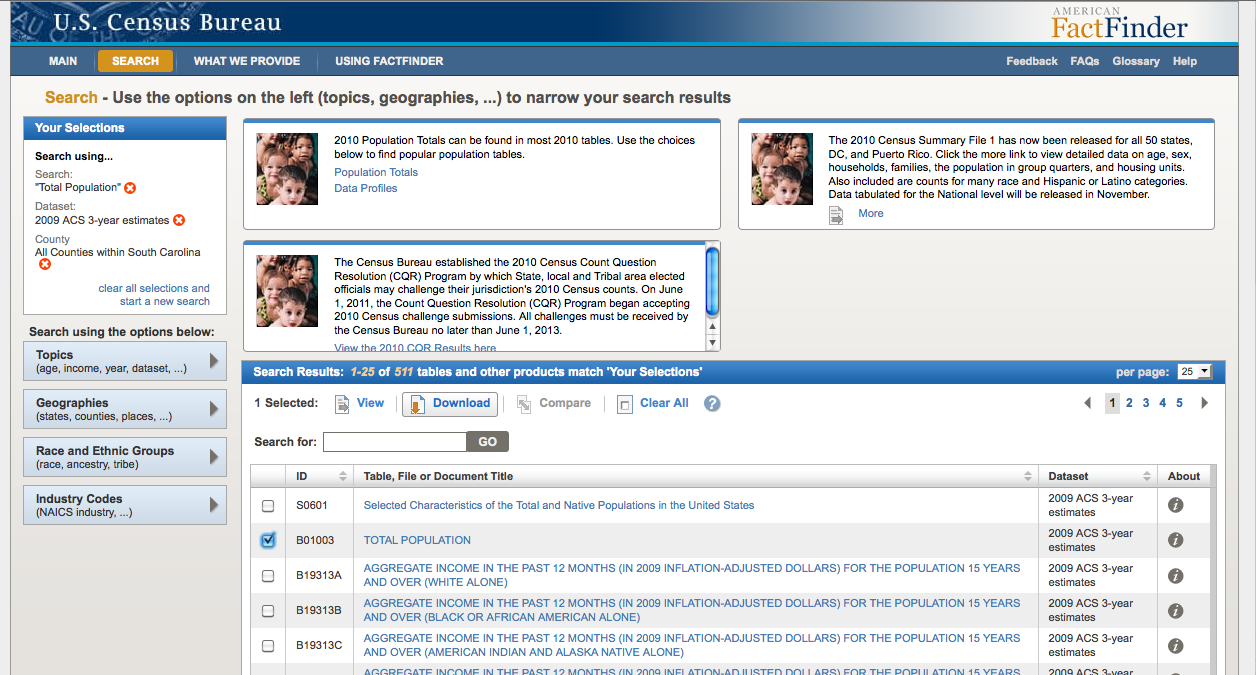
Steps for Selecting Variables
Start by finding the Total Population data. Type Total Population in the Search bar. Find the Total Population variable with the P1 Id (found in the ID Column, next to the check boxes). Check the box for Total Population. Then click Download. A window will appear, click OK. A second window will appear, click Download. Save the file to your desk top. Clear the Total Population search from the Your Selections box.
Next, find employment data by typing Employment in the Search bar. Check the box next to Employment Status (ID S2301). Download the file. Clear the Employment search from the Your Selections box.
Next, find income data by typing Income in the Search bar. Check the box next to Median Income in the Last 12 Months (ID S1903). Download the file. Clear the Income search from the Your Selections box.
Finally, find data on poverty status. In the Search bar type Poverty. Check the box next to Poverty Status in the Last 12 Months. Download the file.
Step 4: Data Extraction and Merging
Now that the data are downloaded. The tricky part is extracting what you want from each file and then merging all of them together. The files are downloaded in .csv format, and each file contains a unique identifier for each county. I use Excel to view and manipulate the downloaded data. However, other programs will work as well.
Steps for Extraction and Merging Data
Begin by opening the Population.csv file in a spreadsheet program. Save the population file as a new file, SC_County_2009. This will now be the file we merge data to.
To clean up this file, delete the Margin of Error Column. Also delete rows 1, 2, and 3 so that only the column label remains.
Next, rename the Estimate column Population, and rename the Geographies column Counties.
Next, open the Employment.csv file downloaded from the Census. The Employment Status file contains a lot of data. But we are only interested in Column J, which contains the Unemployment Rate. To merge this data with the SC_County_2009 file, copy only the numerical data from Column J of the employment status file, and then paste them into the SC_County_2009 file in a new column. (Note: Be sure not to sort the data in any files because it will affect the copy/paste process).
After you paste the data, rename the new column Unemployment.
Next, open the Poverty.csv file downloaded from the Census. The Poverty file also contains a lot of data, but we are only interested in the poverty rate. The poverty file does not contain a poverty rate column. For this reason we will need to collect totals for both the number of people in poverty and the total population for whom poverty status is determined so that we can calculate the rate. Column D contains the population data and Column F contains the poverty counts. Copy the numeric data from Column H and Column F and paste into the SC_County_2009 file as new columns.
After you paste the data, rename Column D to Pop_Pov and rename Column H to Poverty.
Finally, open the Median Income.csv file. This file has a lot of data, but we are only interested in the Median Income for each county, which is located in Column F. Copy the numbers from Column F and paste into a new column in SC_County_2009.
After you paste the data, rename the new column Income.
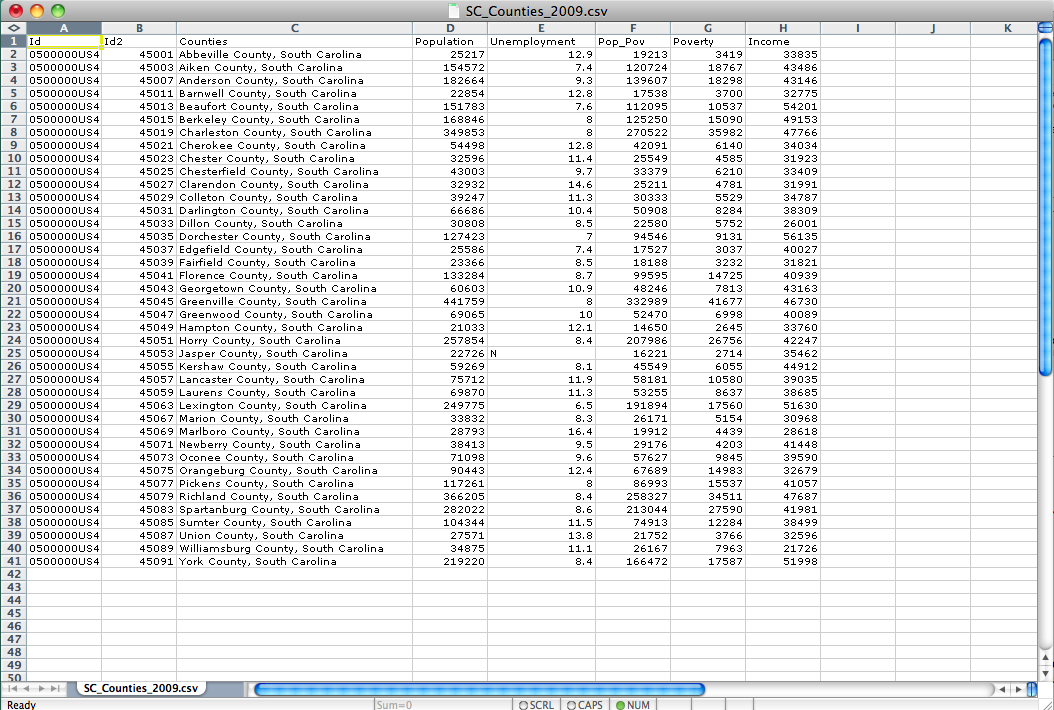
At this point you should have a new file (SC_County_2009) that contains columns: ID, ID2, Counties, Population, Unemployment, Pop_Pov, Poverty, and Income. Save the SC_County_2009 file.
Now that we have our Census file created we need to join it to a geographic file so we can create maps. However, to joint the data to a geographic file we first need to download the geographic file. To download the South Carolina shapefile go to the Tiger Line Files
Select Counties or Equivalent areas in the drop down menu. A new window will open allowing you to chose the states to download data from. Choose South Carolina and click Download.
- Import the South Carolina shapefile to Cartographica.
- Choose File > Import Table Data...
- Choose the SC_County_2009.csv file.
- Click the Join tab
- Select South Carolina as the Target Layer
- The next step identifies a unique identifier used to link the boundary file to the .csv file. To link the two datasets each county is assigned a unique identifier, which is contained in both data sets. In the South Carolina Census file we can use the ID2 column as the link to the South Carolina shapefile GEOID10.\ Under the Map To column click on the arrows in the ID2 row and change them to GEOID10. Then check the box under the Key column in the in the ID2 row.
- Then click Import. The data should now be visible in the data viewer.
- Click on File, and then Export map to save the new shapefile.
You're Done!