- Tue 02 August 2011
- Cartographica
- Rick Jones
I recently found a website for Nordpil who have made available a data set of major urban centers world wide. The data set contains population data for all of the world's major cities. I created a Kernel Density Map using Cartographica to show where the highest densities of urban areas are located. I discuss the process in this post.
Cartographica makes it easy to quickly explore GIS data. If you need the data for professional purposes then Cartographica allows you to make sharp looking maps in only a matter of minutes, while also allowing you to visualize your data. I downloaded the city data from the Nordpil website and then created a Kernel Density Map. To make my Kernel Density map more appealing I created a custom color scheme.
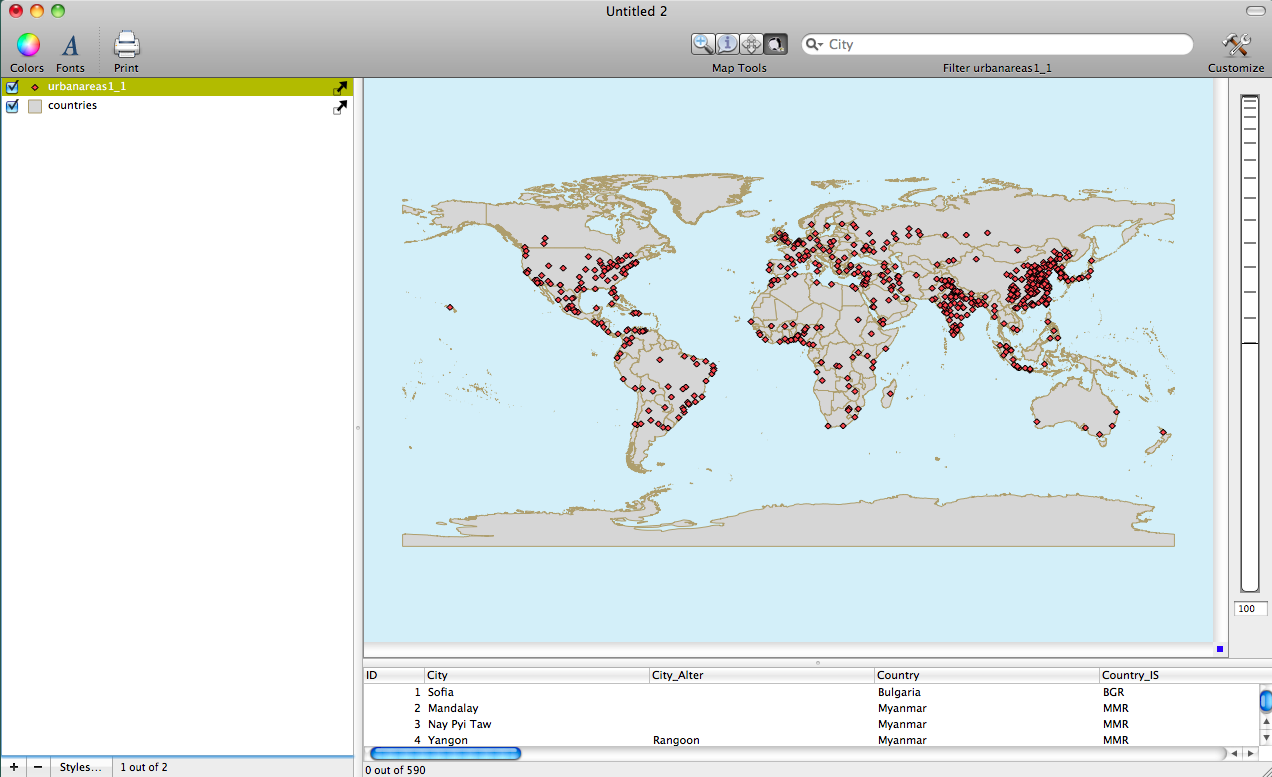
Here is a screenshot of the data imported into Cartographica. I should mention that the base map of the world was not downloaded from the Nordpil website. However, a shapefile can be downloaded from Diva-Gis I made the countries map Grey using the layer styles window so that the points could be easily seen and because I want to countries to be easily seen once I create my KDM map.
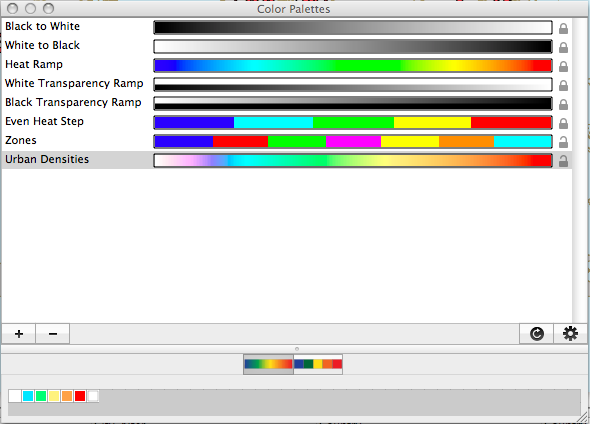
I created a new color scheme using Cartographica's Color Palettes window. This feature is really nice because you can literally create any customized color scheme that you want. Also you can use Color Brewer which I have already done a post about if you are interested. The second screenshot shows the Color Palettes window, which is where you can customize your color scheme.
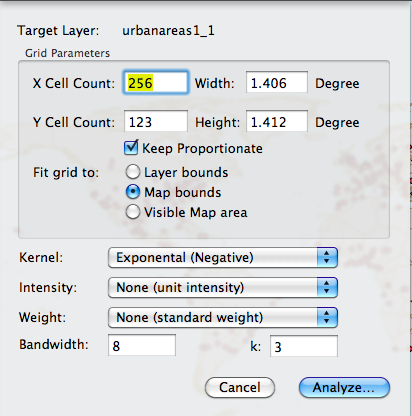
I created a KDM map using the exponential function which creates a nice looking map. Remember that you can hold the option button and then click on the KDM tool to bring up the additional KDM functions. The KDM option window is shown in the screenshot below.
Next, I applied my customized Urban Densities palette to the new KDM map by simply clicking and dragging the color palette on to the KDM layer in the layer stack. The two images below show the before and after KDM once I applied my color scheme.
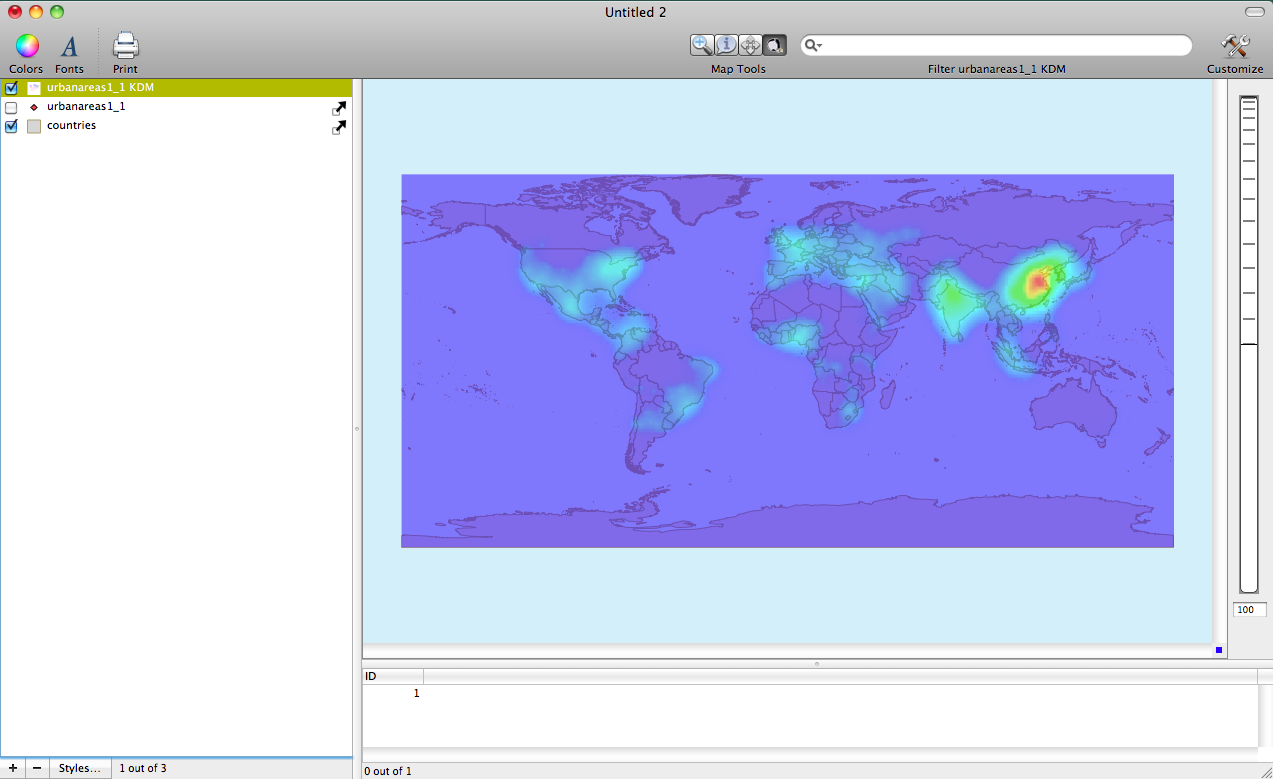
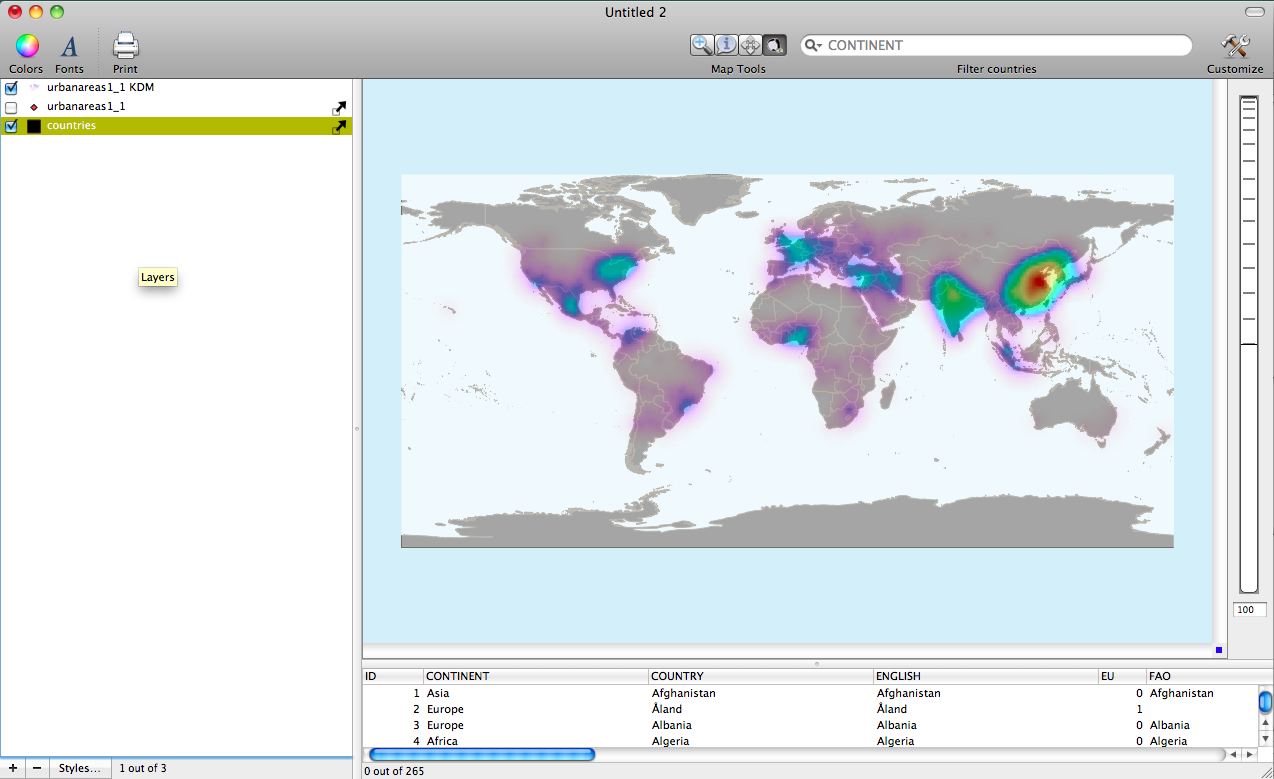
The final map show where in the world the highest concentrations of urban centers are located. The major areas that we know contain much of the worlds population are highlighted. Eastern China, India, Europe, and the Northeast United States all have high concentrations of population, which is reflected in the maps.