- Thu 14 July 2011
- Cartographica
- Rick Jones
In a recent article by Time a state lawmaker from California has suggested that California split into two separate states. While the article mentions that this is not the first time this type of shake up in the state has been suggested (Its been suggested 220 times!) the proposal seems to be getting more coverage this time around. I found the idea of splitting interesting and I wondered how the two states would differ in terms of social and political issues. For this post I am going to see which of the two new states would have more economic problems. To answer these questions I collected census data on poverty levels in all of the California counties and imported them into Cartographica.
The Time article mentions that lawmaker Jeff Stone has suggested that the state be split into Northern and Southern California. Southern California includes Fresno, Imperial, Inyo, Kerns, King, Madera, Mariposa, Mono, Riverside, Orange, San Bernadino, San Diego, and Tulare. In order to create a new map that includes both Northern and Southern California I collected a Shapefile for all California Counties from the U.S. Census.
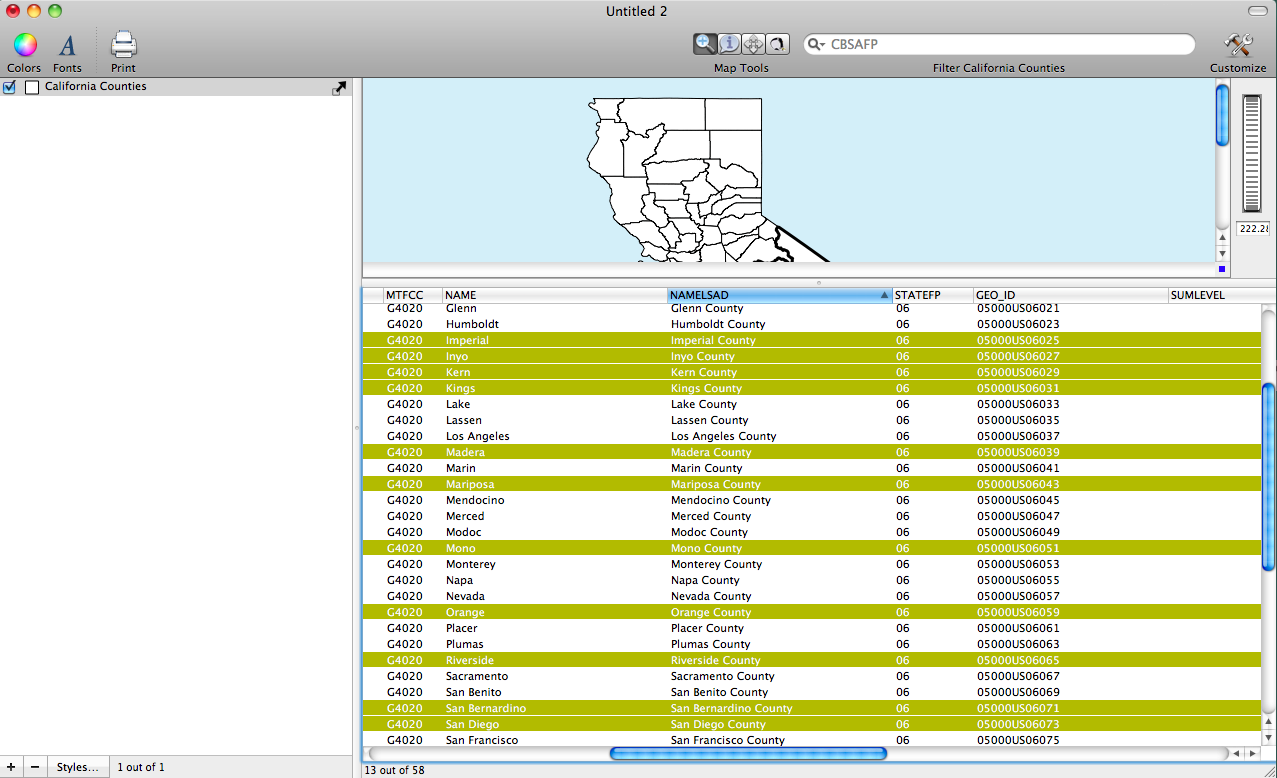
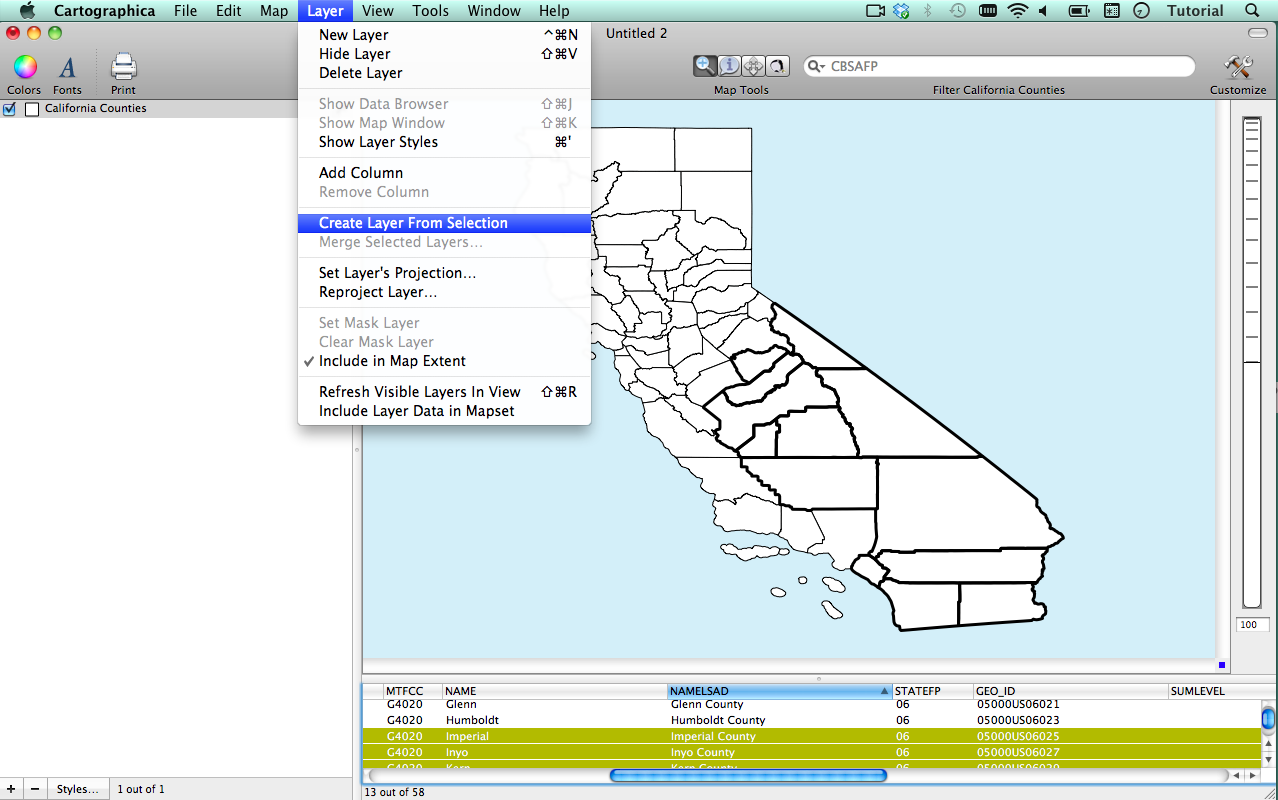
After importing the County file into Cartographica I divided the counties by selecting all of the counties listed in the list above by simply selecting them in the data viewer. I show this process in the screenshot below. After the county names are selected I used the Create Layer From Selection tool.
After I created the Southern California counties layer I used the identify tool to select the rest of the counties that were not in Southern California to create the Northern California Layer. Then I used the Create Layer from Selection tool to create the new layer.
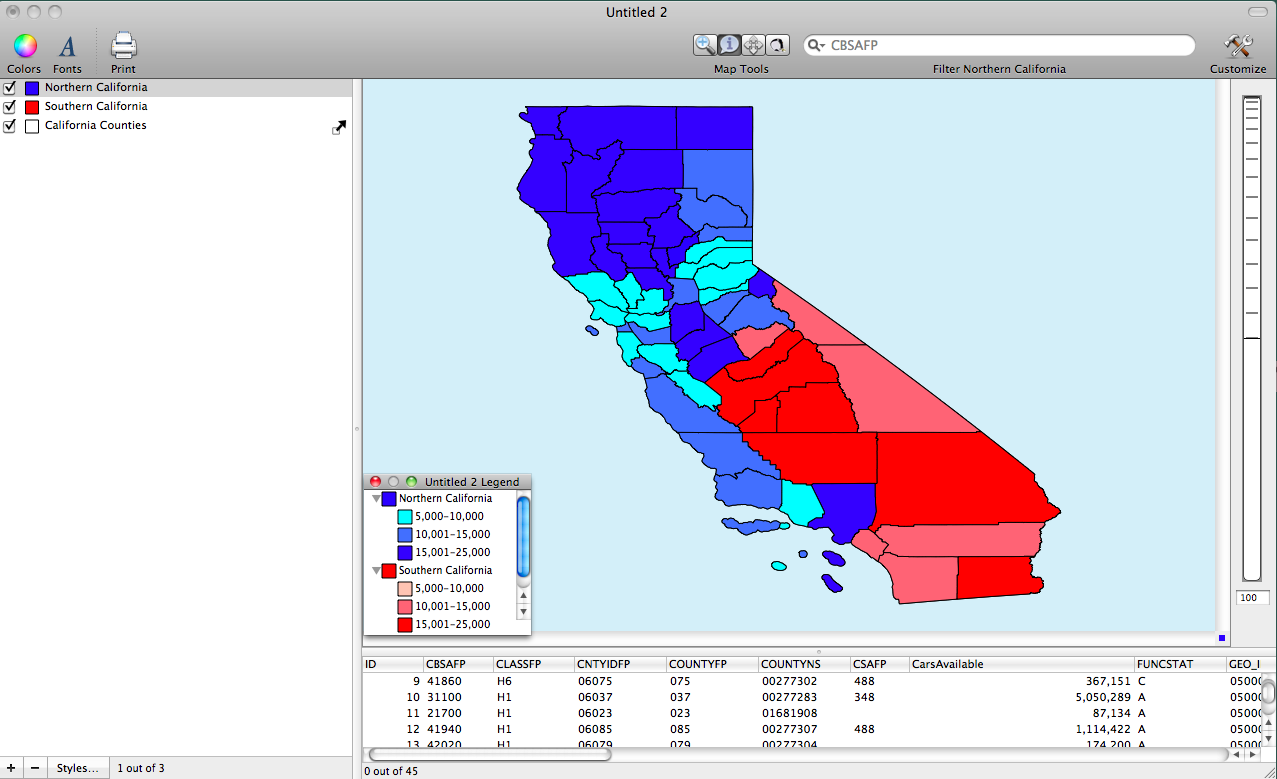
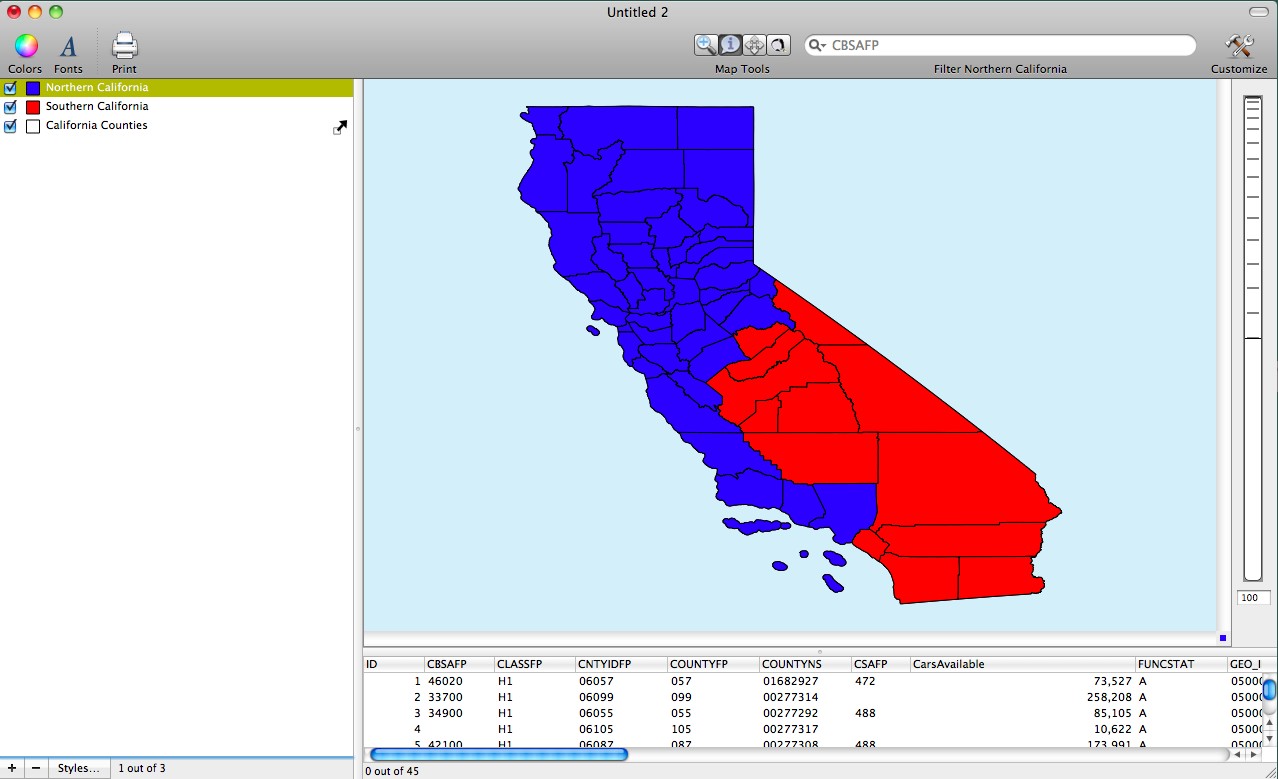
The map of the two new proposed states is shown in the next screenshot.
To answer my question about the differences in economic problems I looked at which state had higher levels of poverty. To make accurate comparisons I needed to create poverty rates (to see how to calculate rates check out my last post: Calculating Rates With Cartographica. I calculated the rates for both Northern and Southern California and I used the equation...
:::none
Poverty Rate = (Poverty/Population)(100000)
The map showing the results in shown in the following screenshot. Examining the distribution of poverty rates shows that both Northern and Southern California have counties with high poverty rates. Northern California appears to have many more counties with low poverty rates.