- Thu 03 January 2013
- Cartographica
- Rick Jones
- #Street Segments, #join
Recently, authors David Weisburd, Elizabeth Groff, and Sue-Ming Yang published a book titled The Criminology of Place: Street Segments and Our Understanding of the Crime Problem. The crux of the book is that in Criminology and other disciples have a long history of using geographic units of analysis that are area based. That is, we have become accustomed to using polygons as units of analysis. Part of the reason for the use of area based units of analysis is that demographic and social data are available through sources like the United States Census Bureau. In the book, the authors make a compelling argument that area based studies miss a lot of spatial variation that occurs at lower levels of analysis. In an attempt to combat the loss of information through aggregation the authors show that using street segments as units of analysis may be a viable alternative to area based units of analysis.
In the spirit of using street segments as units of analysis we thought highlighting how to use Cartographica to aggregate data points to street segments would be a fun and interesting exercise. Recent upgrades to Cartographica 1.4 include the ability to spatially join data based on their spatial association. This includes joining points to lines.
The data being used in this example are from Washington D.C.'s GIS repository DCGIS. The data are 2011 crime incident locations and a street file containing all of the street segments in the city.
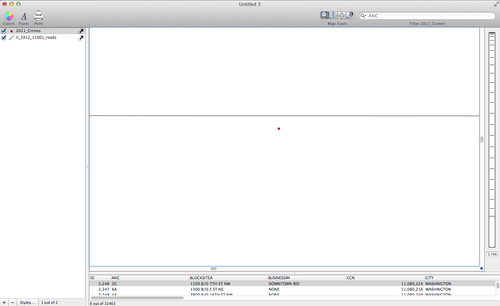
To import the data into Cartographica choose File > Import Vector Data. Below is an image of the data described above. At first glance it appears as though the points are "on top of" the line segments. Observe.
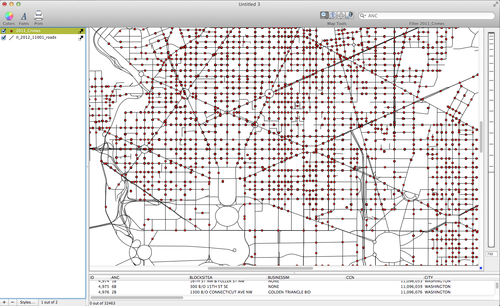
However, upon closer inspection you can see that the points are not directly on top of the lines. As a result, we will need to use a distance based spatial join to join the crime points to the line segments.
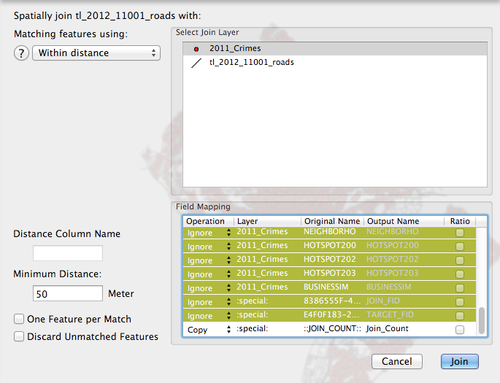
Because we want to join the crime points to the street segments we first need to select the Streets layer in the layer stack. Once selected, choose Tools > Spatial Join. The following image shows the set up for the Spatial Join. Uncheck the Discard Unmatched Features so that the new join layer will have all of the street segments including those that have zero crimes. Note that the "Within Distance" operation is selected and a distance of 50 meters is the designated distance. Also note in the table that the 2011 crime data fields are set to ignore. The reason for this is that at this point we do not need all of the excess crime information. All we want is the counts of crimes on the various street segments. Finally, note that the last field in the table "Join Count" is selected to be copied. This will be the new field on the street segments layer that will contain the crime counts.
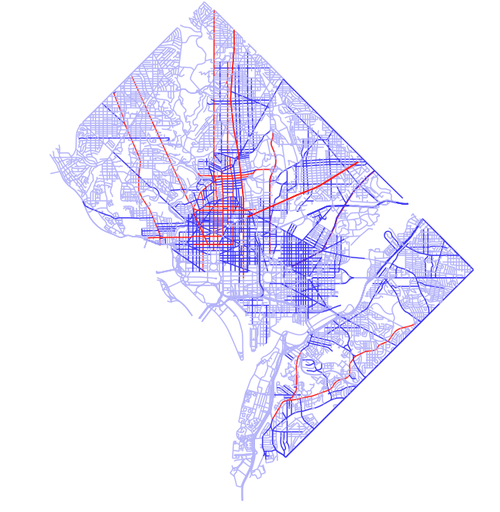
After the points are counted and aggregated to the street segments you can reclassify the counts into groups and then vary the street segment colors by the groups. Double-click on the streets join layer in the Layer Stack to brig up the Layer Styles Window. Add three categories to the table by click on the + button. Click on the Gear Box and select Distribute with Natural Breaks (Jenks). Change the colors of each of the categories by clicking on the fill box and choosing a series of colors. See the map below for the final result.