- Wed 22 June 2011
- Cartographica
- Rick Jones
Cartographica is great for exploring data and for providing a quick way to evaluate geopolitical problems. The South China Sea dispute is an ongoing feud between the countries that have land bordering the South China Sea. In this post I show how to quickly add data and to create new layers that can be used to evaluate problems.
This post is fairly practical. I read an article about the South China Sea dispute and found the issue to be quite interesting. However, I know little about the area and thought that a little analysis of my own might help me understand the problem a little better. I found an article by the Energy Information Administration who likely have an interest in reporting on this issue because a big part of the dispute is over the rights to an abundance of oil and natural gas in the South China Sea. The article provides a map of the area in question. To recreate the map I used Cartographica's add new layer and edit feature options, which allow for the quick and simple creation of new layers.
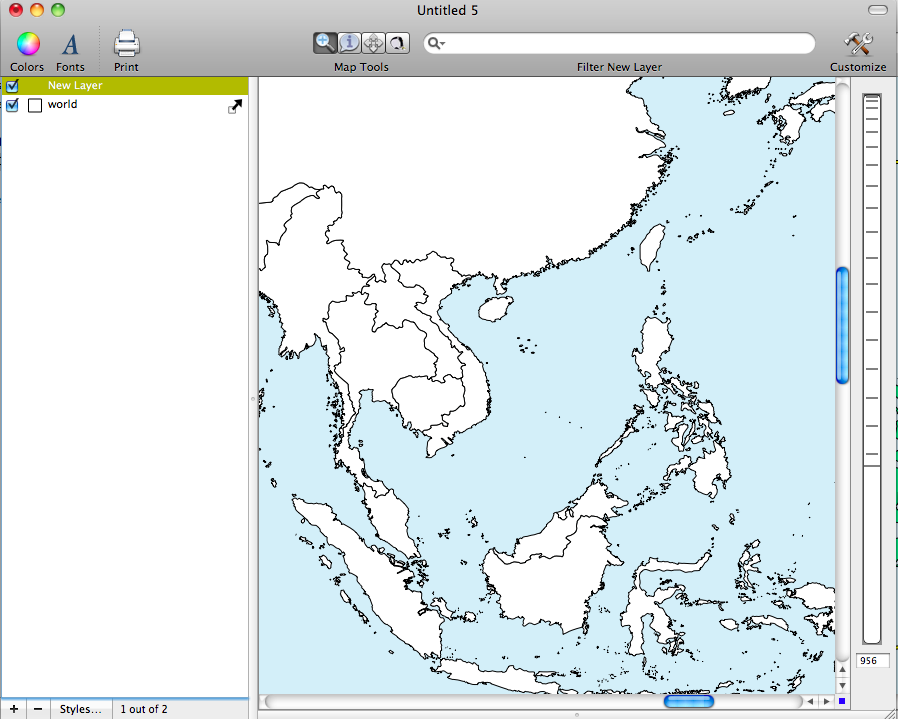
The first image below shows adding a new feature. This is really an easy thing to do and it is very useful for creating new spatial files. To add a new feature click the "+" button at the bottom of the layer stack
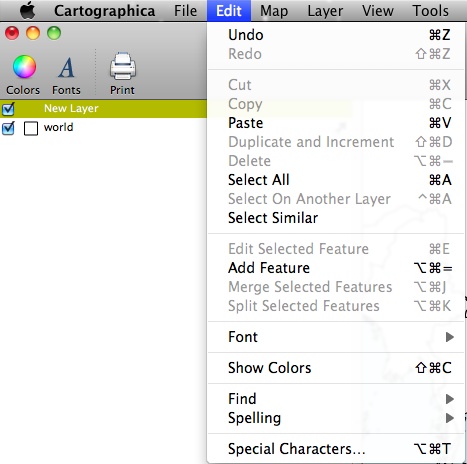
The second image shows the add feature option under the Edit drop down menu. Once a new feature is added to the layer stack you can use this option to begin the editing process.
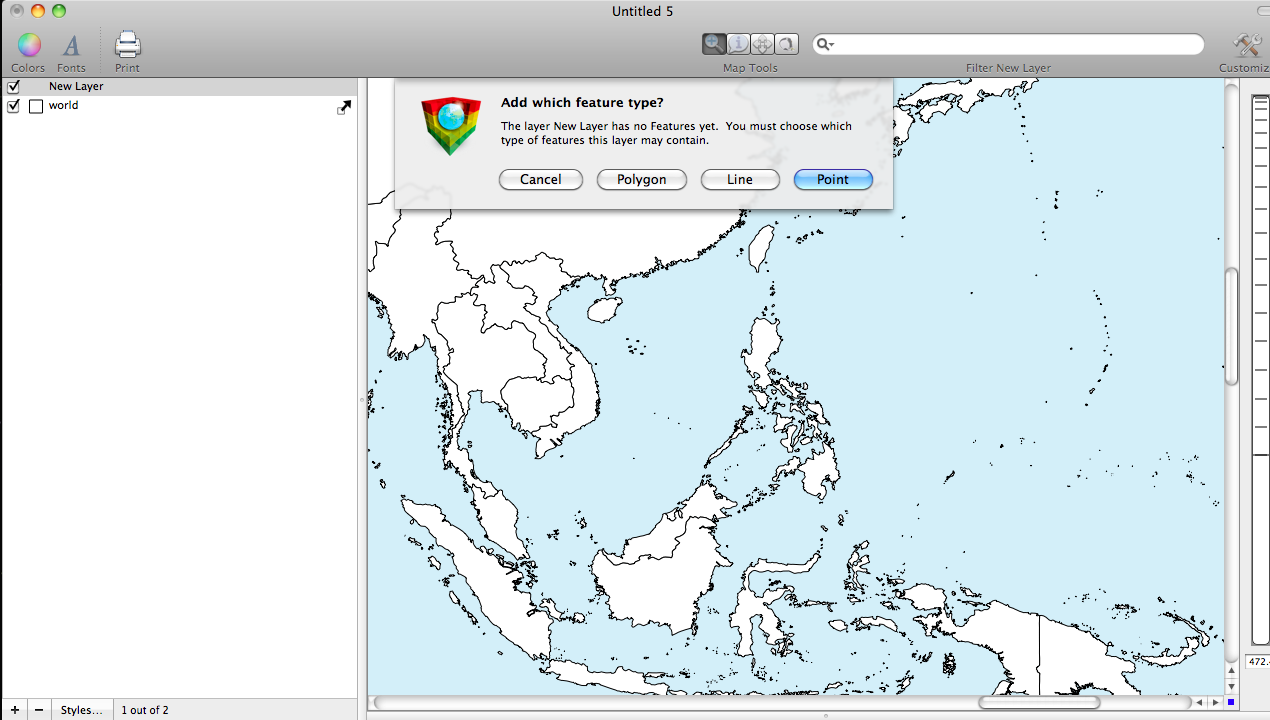
The third image shows the feature type selection window, which allows you to choose to add a point, line, or polygon. For this example I used lines for each country's boundary claim, and I used polygons to highlight where in the South China Sea Oil and Gas are located.
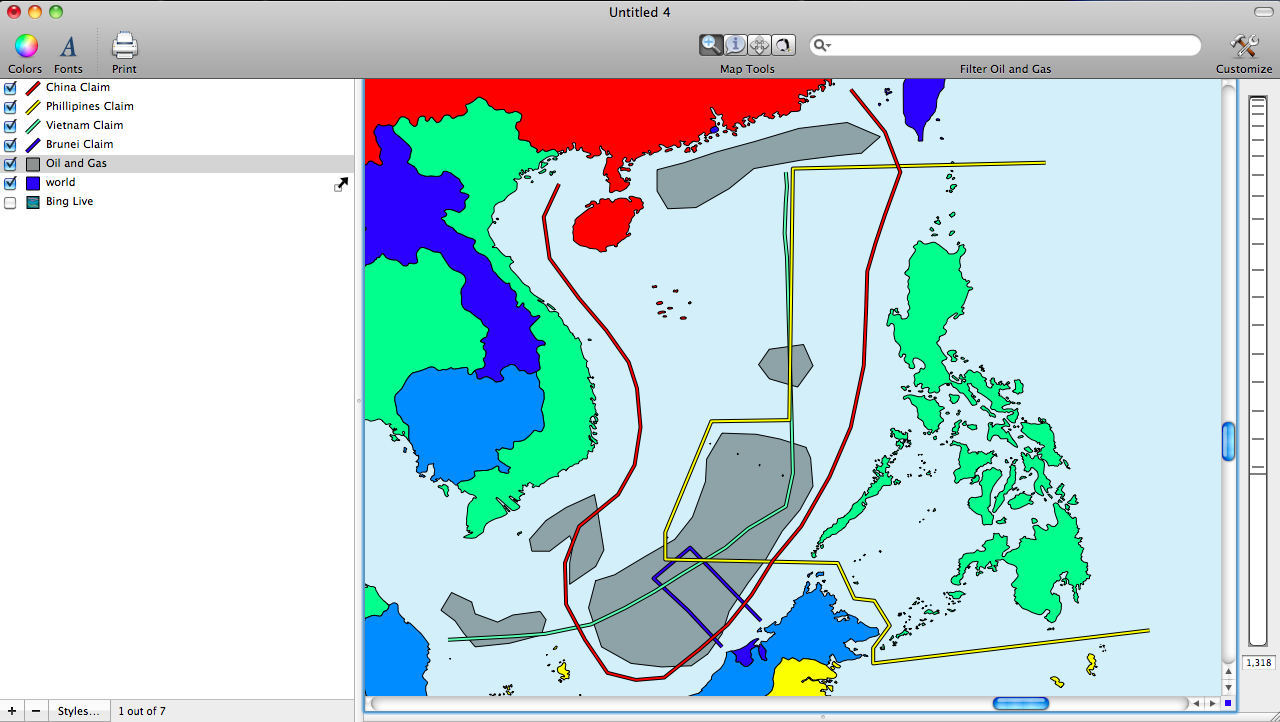
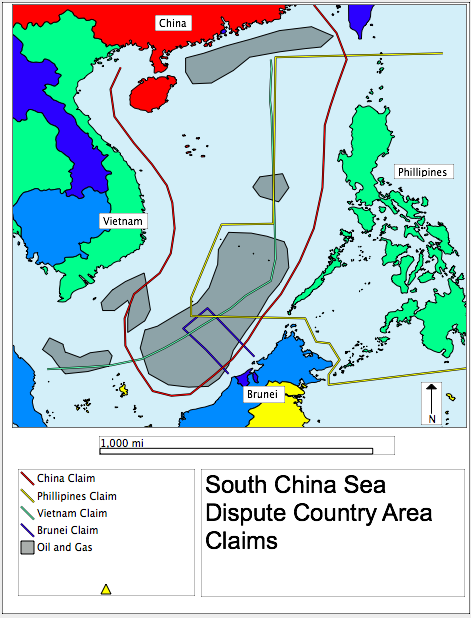
The final two images show the claimant boundaries and the oil and gas fields. Its pretty clear from the map that the location of Oil and Gas is what is driving the creation of the boundary claims.
The ability to quickly view and explore geopolitical problems makes Cartographica useful to a large number of people including geopolitical researchers, geologists, and other social scientists that might be interested in creating informative maps that describe the problems facing an area. This post shows that it is easy to quickly create and edit new features that can make a map look professional and easy to read!