- Tue 06 March 2012
- Cartographica
- Rick Jones
- #tornado, #weather
Given the recent and tragic outbreak of tornadoes across the Midwest I thought it would be appropriate to do a blog on tornadoes. Before I continue I should mention how sorry we are at Cartographica that so many lives were lost and that so many homes were destroyed. Towns likes Henryville, Indiana and West Liberty, Kentucky were among the worst hit by the recent tornado outbreak.
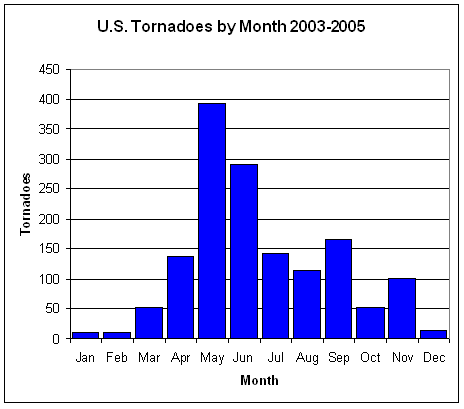
I found an interesting website on the National Oceanic and Atmospheric Administration's website. The website provides a lot of historical information about tornados in the United States. A particularly interesting fact from the website is that there are comparatively few tornados in the months of February and March, which makes the recent outbreak seem that much more unusual and unfortunate. The image below is a bar graph of the monthly tornado frequency. You can see the limited number of tornados this time of year. Read more throughout the report on the NOAA link posted above to find out about more about Tornados in the U.S.
Before we get started mapping tornado data add a baseman of U.S. States. You can find a basemap here. After you download the States shapefile, import it into Cartographica by choosing File > Import Vector Data
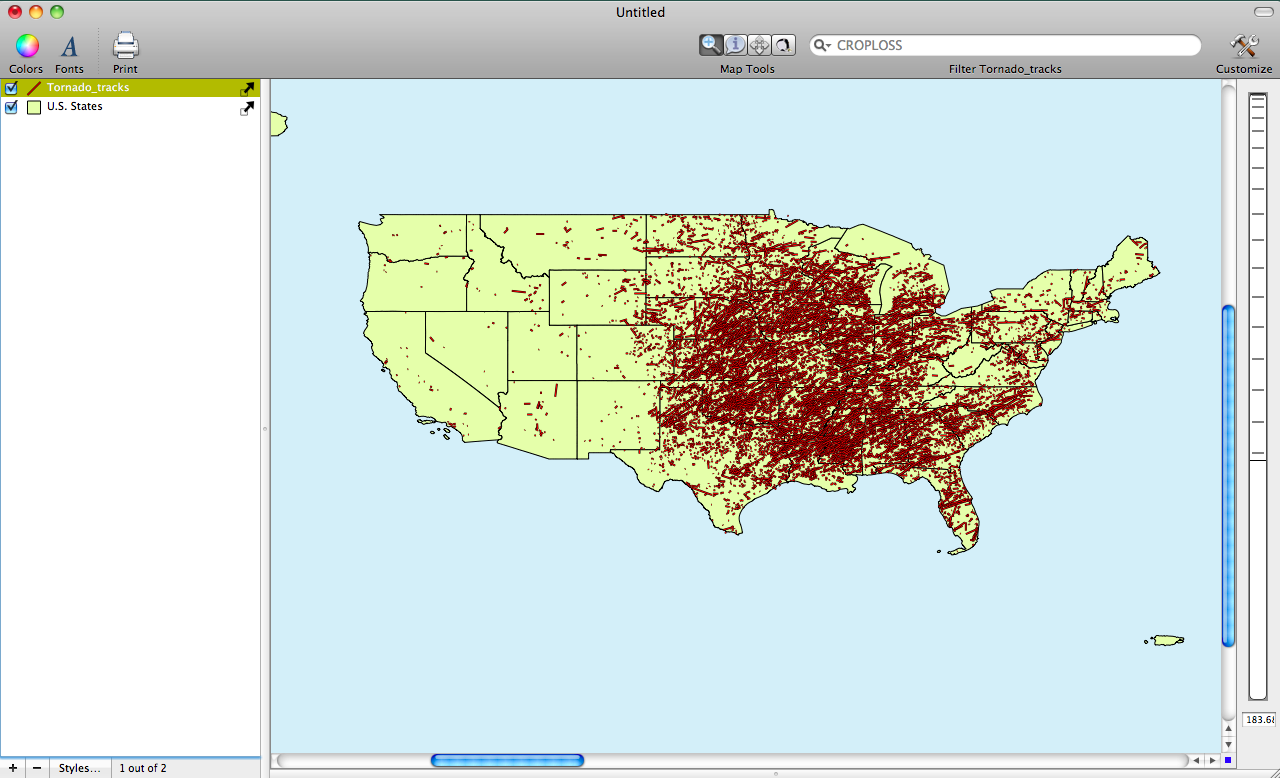
I found some interesting data on Tornado tracks from this NOAA website. Tornado tracks are lines that track the movement of tornados as they advance from an origin point. You can download the Tornado_Tracks.zip file beneath the tracks image on the website. Once you download the data import it into Cartographica by choosing File > Import Vector Data. The data set is extensive as it covers tornados from 1950-2010. I provide an image of the file below.
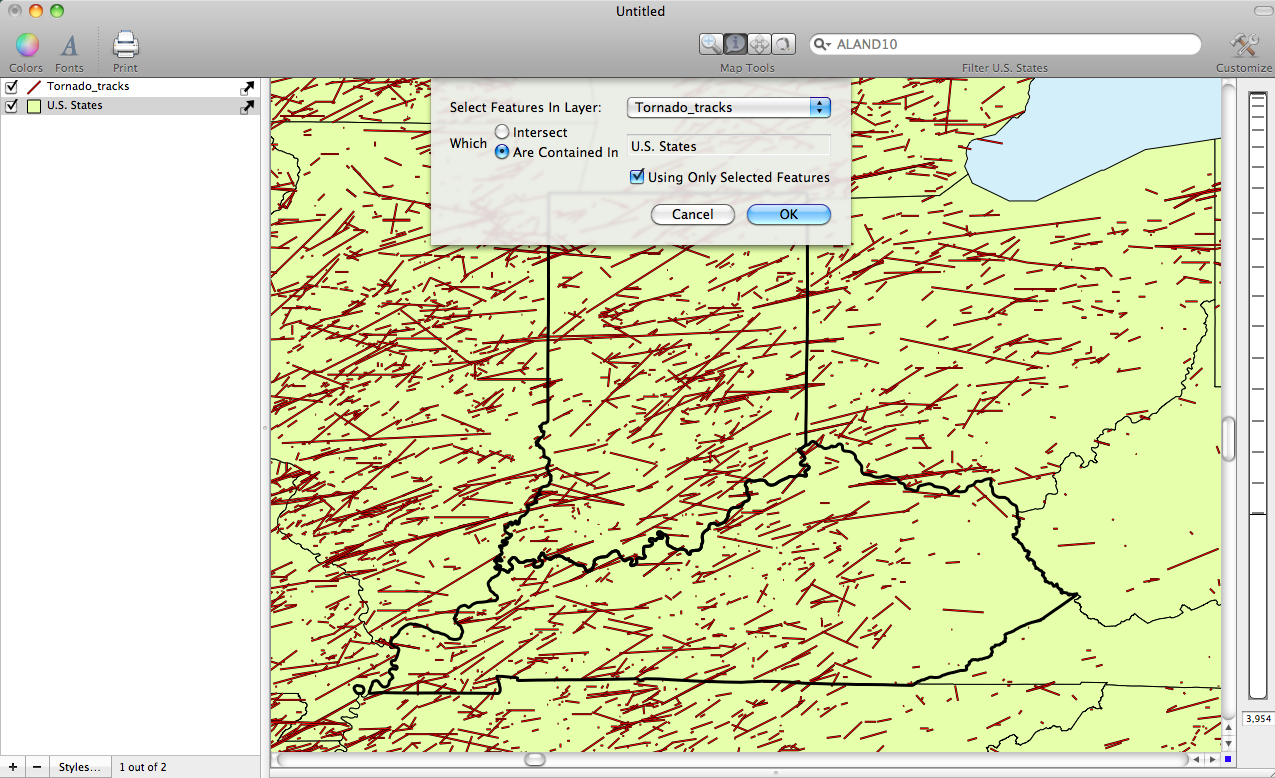
Next, I wanted to create a map that only includes tracks in Indiana and Kentucky. To select only the tracks within Indiana and Kentucky select the U.S. States layer in the layer stack, then select the identify tool, and while holding down the shift key, click on Indiana and Kentucky. Both States should be highlighted. Next, choose Edit > Select on Another Layer. Set the Select Features in Layer to Tornado_Tracks and choose the Are Contained In option. Then click OK.
You will see that all of the tracks in Indiana and Kentucky are selected. Next, we can create a new layer that only contains those tracks in Indiana and Kentucky. Choose Layer > Create Layer From Selection. This will add a new layer to the layer stack. Rename the layer IN-KY Tornadoes. I provide an image below.
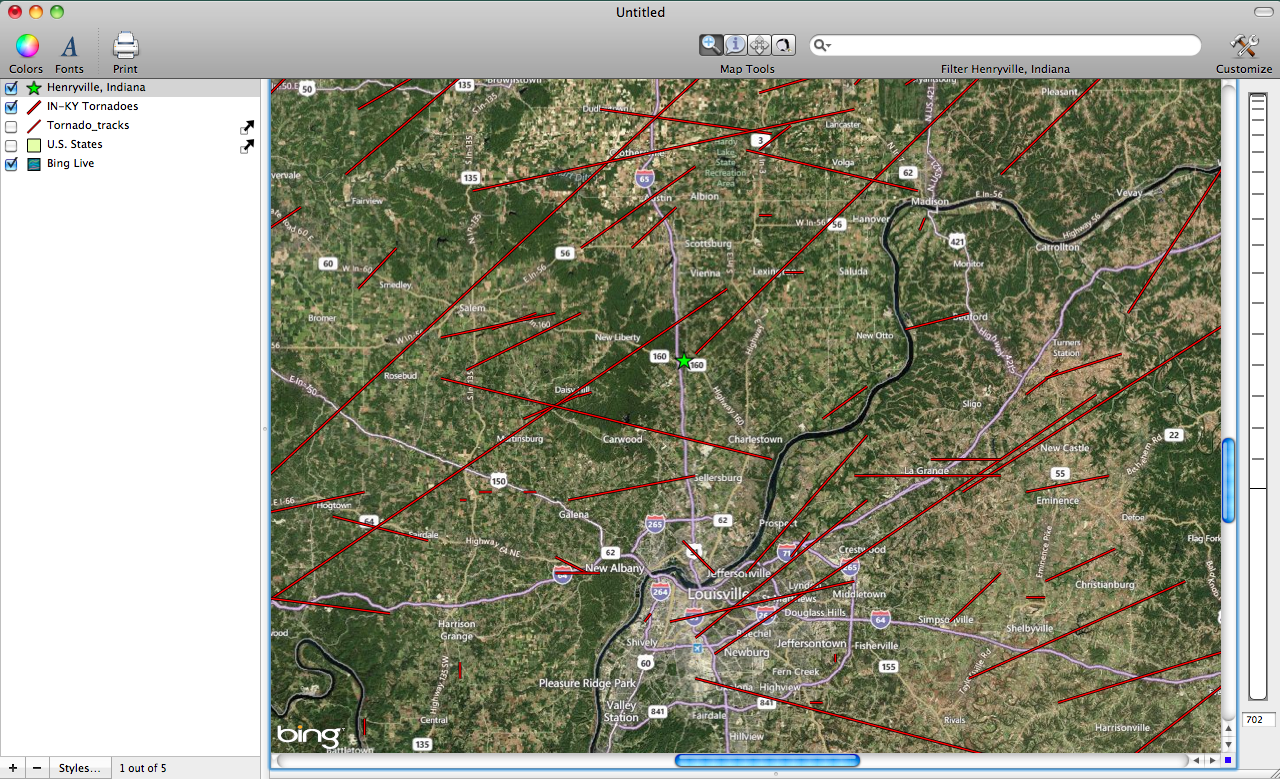
To add a little more context to the map I am going to add a Live Map. Choose File > Add Live Map. In the drop down menu choose Roads on Aerial Imagery. Uncheck the U.S. States Layer in the Layer Stack.
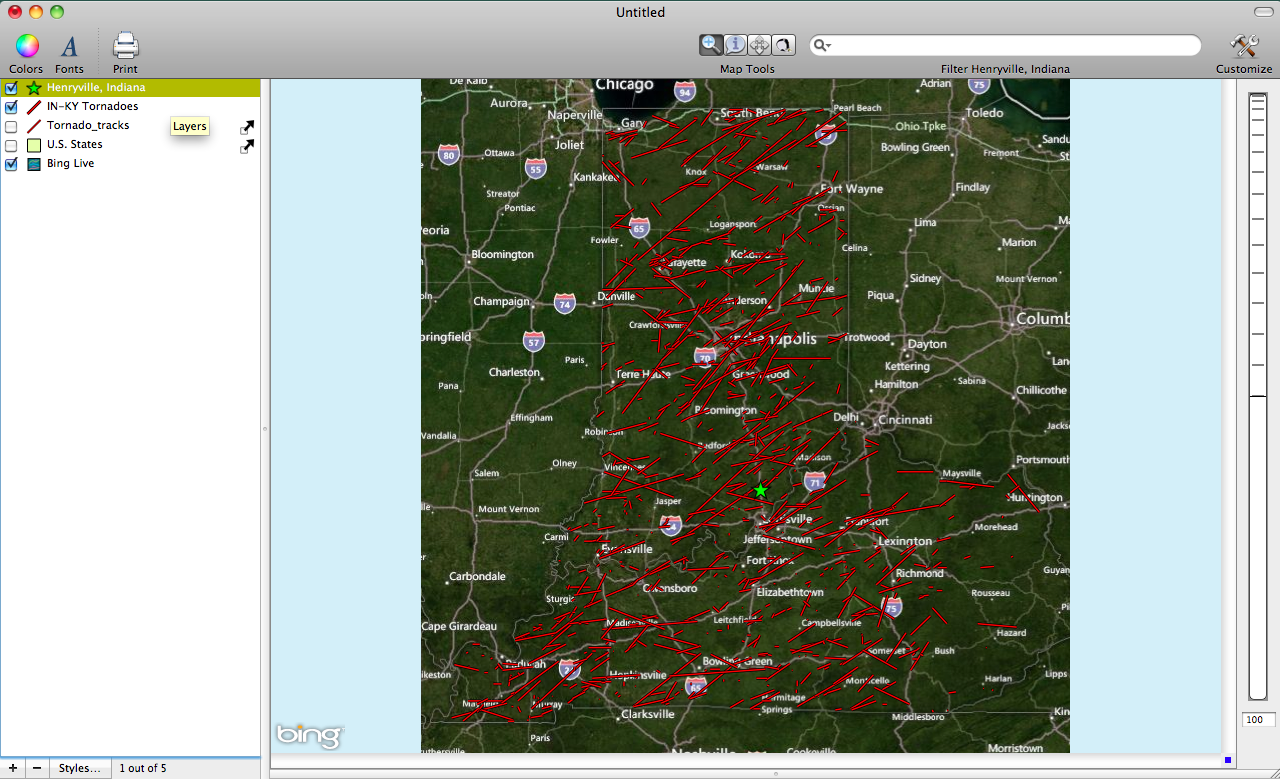
To highlight the location of Henryville, Indiana I added a new layer by clicking on the + button at the bottom of the Layer Stack. Then choose Edit > Add Feature and choose the Point option. Then hold down the control key and place the point on Henryville.
The two images below show the location of Henryville, Indiana and the paths of historic tornadoes. It appears that the recent tornado that caused so much destruction in Henryville was the first since 1950 to pass directly through the town. Coupled with the fact that such a violent tornado occurred in very early March makes this event seem exceedingly rare and unfortunate for those who have been affected.