- Tue 23 October 2012
- Cartographica
- Rick Jones
- #analysis, #overlay
New to Cartographica 1.4 is the ability to perform Overlay Operations. Overlay Operations are useful in many contexts when working with spatial data as they make limiting or expanding datasets via spatial location simpler and more efficient. Below are descriptions of the various Overlay Operations that Cartographica has in place for version 1.4. Each serve a specific purpose that you may encounter while working with spatial data.
Clip Function: Clips all target layers to the Clip layer. The Clip layer can be thought of as a cookie cutter. The boundary of the Clip layer is the outline of the cookie cutter. The Target Layer is the rolled out cookie batter. The output of the Clip function is a new layer that includes only the area that was contained within the boundary of the Clip layer.
Erase Function: The Erase function works opposite of the Clip function. The idea with the cookie cutter is the same, except that rather than clipping a cookie from a large batter and then focusing on the cookie, it erases the cookie and focuses on what’s left of the batter.
Intersection Function: The intersection function creates a new layer based on the intersection of multiple polygon layers. The intersection function is also commonly referred to as the "and" function. The intersection is the area where both polygon A "and" polygon B are located. The intersection function creates an empty layer when the polygons do not share common space (i.e. layers that are mutually exclusive).The output of the intersection function is a new layer that contains only the areas the fit the definition provided above.
Union Function: The union function creates a new layer based on the combination of multiple polygon layers. The union function is commonly referred to as the "or" function. The union function can operate on polygons that are either mutually exclusive or non-mutually exclusive. In both cases the resulting layer will include all space occupied by both layers. Unlike the union operation in probability theory, the spatial union does not have to deal with issues of double counting non-mutually exclusive areas. The areas that overlap are simply added to the final layer.
Difference Function: Creates a new layer that includes areas of two polygons that do not overlap. Areas that occur in both layers are not present in the resulting layer. The idea is that the non-overlapping areas are removed, not the polygons. Sometimes the area is just one polygon, but it might also be all of one polygon and parts of 2 others.
Update Function: The update function updates a target layer with features found in another layer. For example, if you have a new and an old street file the new street file can be used to update the missing streets on the old street file.
Identify: Identifies features in target layers with operation layer features. For example, the identify function can be used when one of two spatially identical layers is missing attribute data. The layer with attribute data (the operation layer) can be used to identify the unidentified features on the layer without attribute data (the target layer).
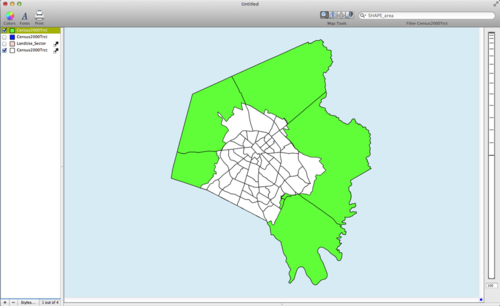
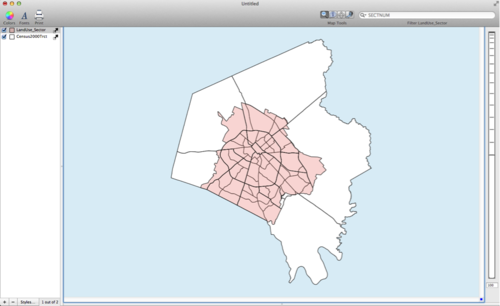
To highlight a few of the new Overlay Operations we can use an example. In the example you will be using Cartographica’s new overlay functions to select features based on their spatial location. Download the Lexington Census Tracts and Urban Growth Boundary. Import the Lexington Census Tracts layer and the Lexington Urban Growth Boundary Layer by using File > Import Vector Data. The Urban Growth boundary layer is a feature unique to Lexington that represents a politically defined limit on urban sprawl. The main reason behind the boundary is to limit urban sprawl from encroaching on to Lexington’s valuable horse farms that surround the city. A key problem with this situation in Lexington is that the county that Lexington is within (Fayette County) is made up of distinctly rural and urban areas. In some cases this feature of Lexington and Fayette county presents problems when conducting various spatial and statistical analyses. As a result, you want to isolate urban and rural counties into separate layers. You can do this using Cartographica’s new Overlay Operations. Below is a map highlighting Lexington-Fayette County with the red-region representing the urban-growth area. All Areas outside of the red space are rural areas within the county.
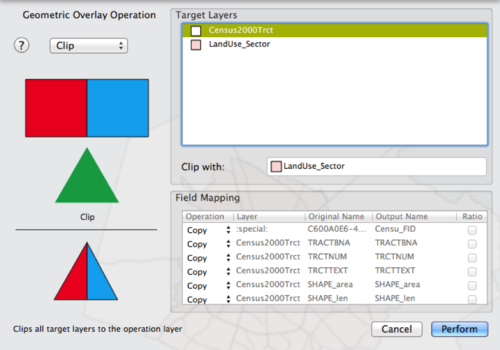
We want to create a new layer that contains only urban areas in the city by cutting out the
rural parts of the census tract layer. To do this choose Tools > Perform Overlay Operation.
To identify only the rural areas within Lexington you need to use the Clip
Function. The Clip function clips all target layers to the operation layer. You can identify
which layer is the target and operation layer within the Overlay Operation window. In this
case the LandUse_Sector layer is the operation layer that will be used to clip out the rural
census tracts. To select the Clip layer click and drag the LandUse_Sector layer to the Clip
with box. Below is an example of the appropriate set up to perform the clip operation. After
you set up the window like shown below click Perform.
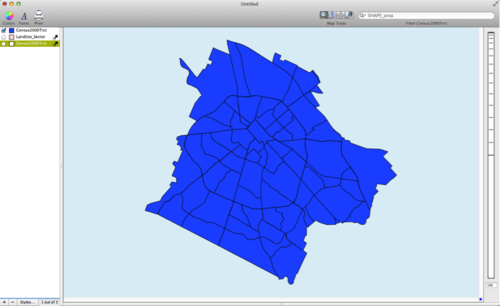
Below is an example of the map of urban areas within Lexington. Note that when the new clip layer is created it will be at the bottom of the layer stack. You need to move the layer to the top of the layer stack and check the box to view the layer’s features. The new layer contains all of the Census tracts that are within the urban growth boundary. This is advantageous because the urban and rural areas in Lexington are distinctly different and may be studied and and understood differently in specific contexts, which requires separate data layers.
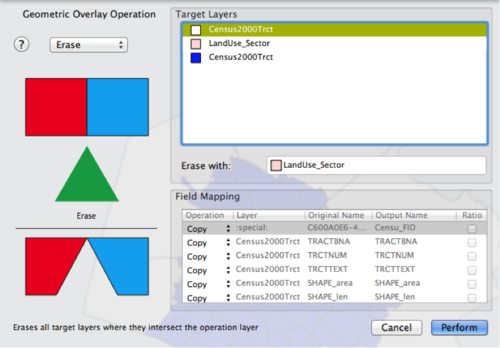
Now you want to create a new layer that contains only rural areas within Lexington by erasing
the parts of Fayette County that are within the Urban Growth Boundary. To do this choose
Tools > Perform Overlay Operation. To create a new layer that contains only rural areas
you need to use the Erase function. Use the LandUse_Sector (urban growth layer) as the erase
layer and the Census tract layer as the target layer. When set up, click perform.
Below is a map of the rural areas in Lexington. Like before, when the new erase layer is created it will be at the bottom of the layer stack. Move the layer to the top of the layer stack and change the layer styles so that it is more easily visible against the other layers. Notice that all of the census tracts that were within the Urban Growth Boundary are now removed from the new layer. View the map below for an example.