- Tue 07 February 2012
- Cartographica
- Rick Jones
- #analysis, #earthquake, #kernel density
Recently there have been several earthquakes around the world. In Negros-Cebu region, Philippines there was a 6.7 magnitude earthquake that resulted many injuries and deaths. The earthquake activity peaked my interest to explore what was happening around the world in terms of seismic activity.
To find data on recent earthquake activity I went to the U.S. governments data portal Data.gov, which is a clearinghouse for thousands of maps and datasets. I found data on earthquakes for the past 7 days. The link to this data is here. When you go to the webpage you will see that you can download the data in .csv or in .kml both of which are readable in Cartographica. I downloaded the file as a .csv. Note: when you download the data you may have to save it as a .txt file and then open it in a spreadsheet application. The spreadsheet application should be able to read the file as a .csv. You can then save the .txt file as a .csv.
Once the data are downloaded importing them into Cartographica is easy. To import the data choose File > Import Table Data.
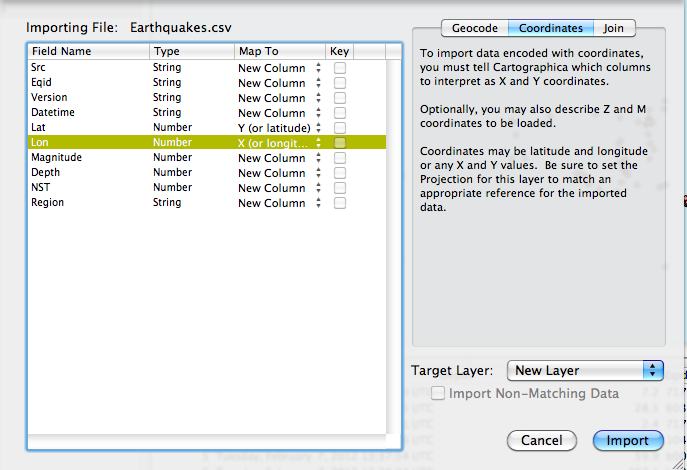
Next, the import data window will appear. The .csv file is download with latitude and longitude data that we can use to create a point map of earthquake locations. Select the "Coordinates" tab in the top right of the import file window. Then change the designations next to Lat and Lon in the table to Y (or latitude) for Lat, and X (or longitude) for Lon, and then click Import.
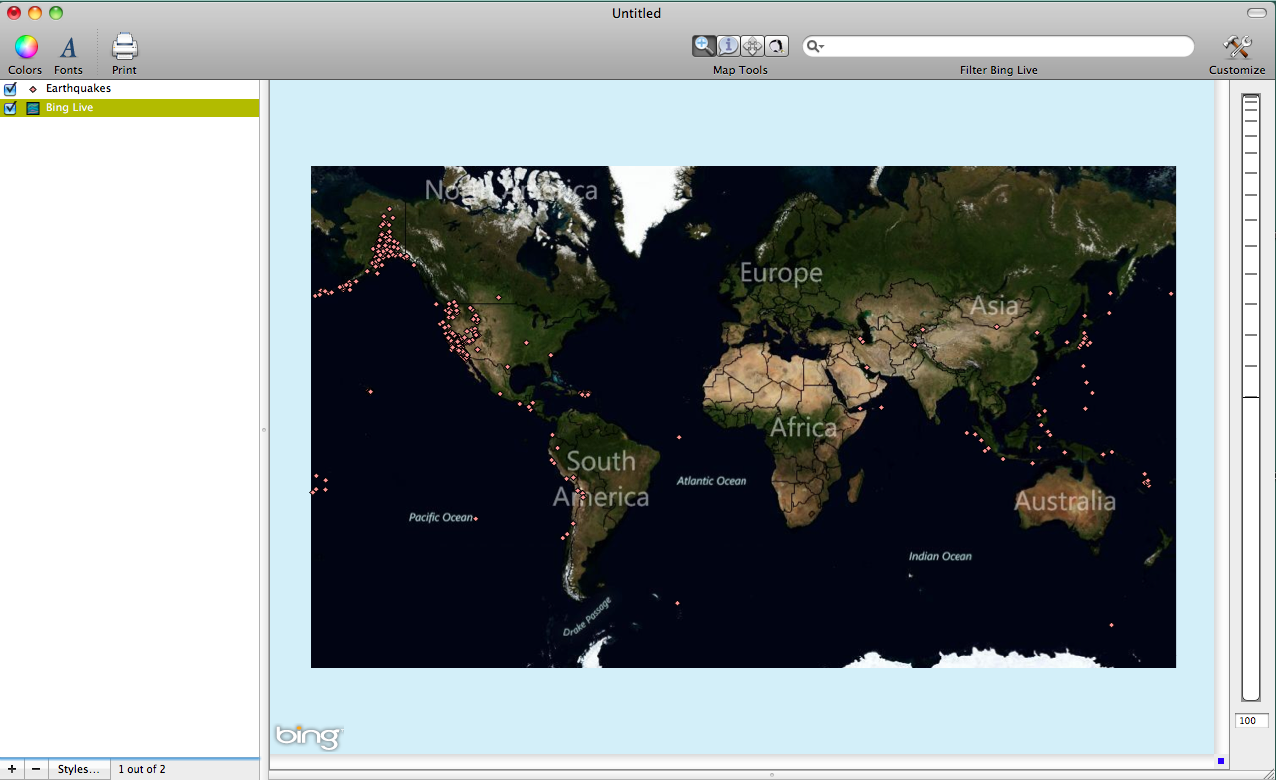
After the points are geocoded you can see them in the map widow within Cartographica. However, to contextualize the points we need to add a base map. This is quick and easy to do in Cartographica. Choose File > Add Live Map. This will add a new base map to help visualize where the earthquakes are located. A screenshot is provided below of the points with the base map.
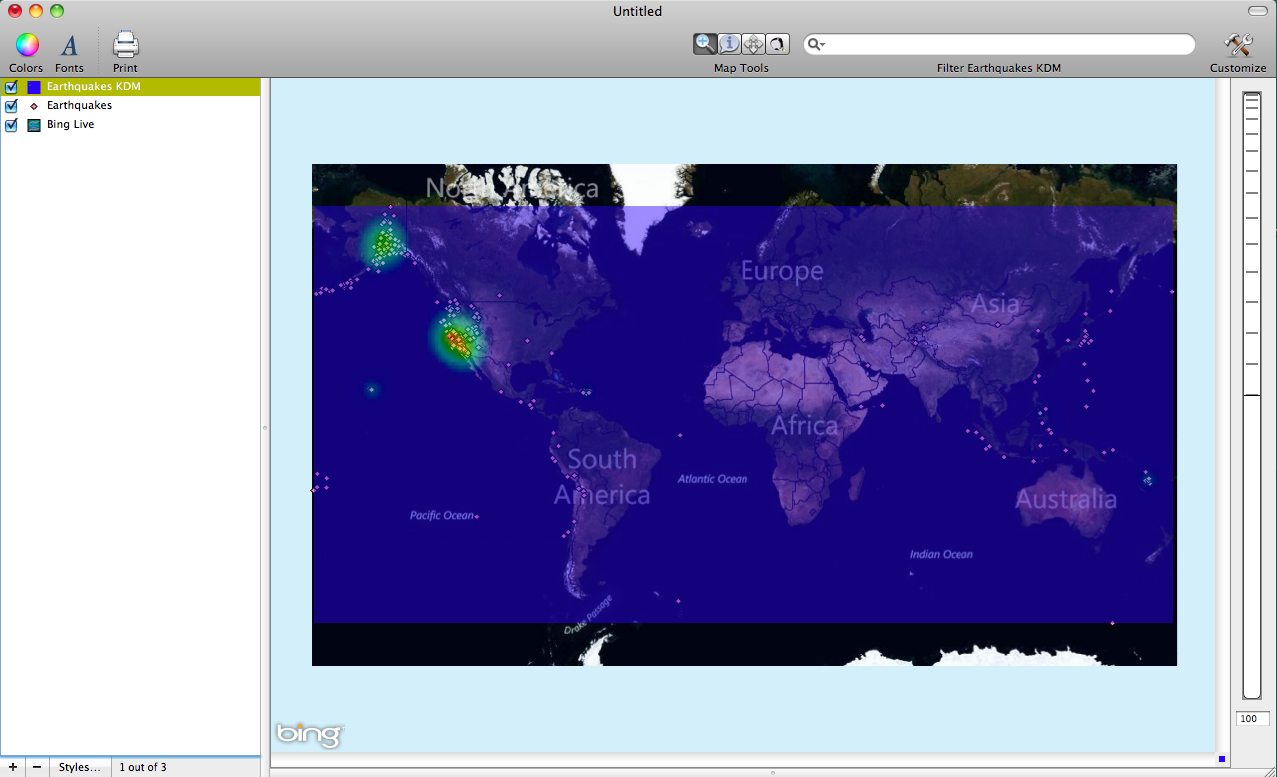
Visualizing the points on the map is only one way we can use the data. We can also create a kernel density map to determine where the highest concentration of seismic activate has occurred over the last seven days. To create a kernel density map select the Earthquakes layer in the layer stack and then hold down the option key and choose Tools > Make Kernel Density Map... This will bring up the Kernel Density window. Change the Kernel type to Exponential (Negative) then click Analyze. A screenshot is provided below of the kernel density map. Note: The layer opacity was changed by double clicking on the the Earthquake KDM layer in the layer stack and then adjusted using the opacity slider. The results indicate that much of the world's seismic activity as been focused on the U.S. West Coast and in Alaska.
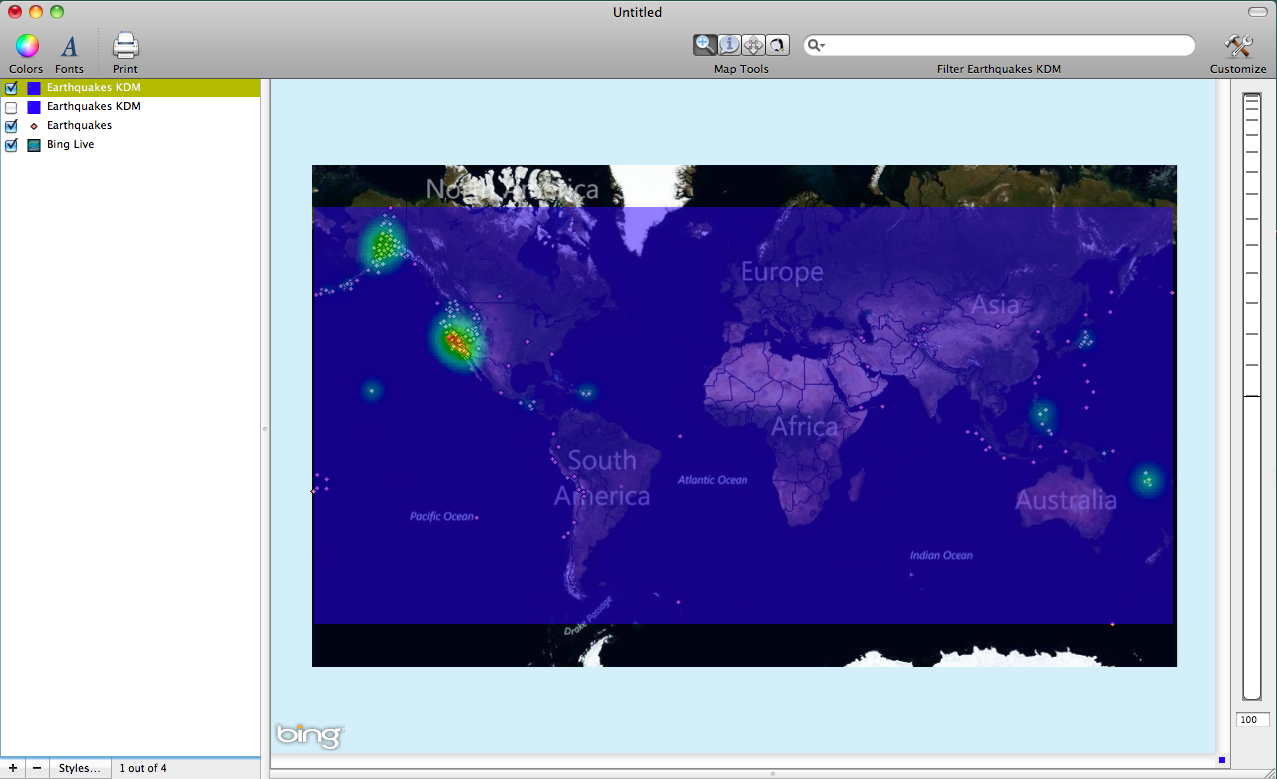
To create a second kernel density map that takes into consideration the strength (or magnitude) of the earthquakes I created a weighted kernel density map. To do this hold down the option key and choose Tools > Make Kernel Density Map... This will bring up the Kernel Density window again. Change the Kernel type to Exponential (Negative) and then change the Weight menu to Magnitude.
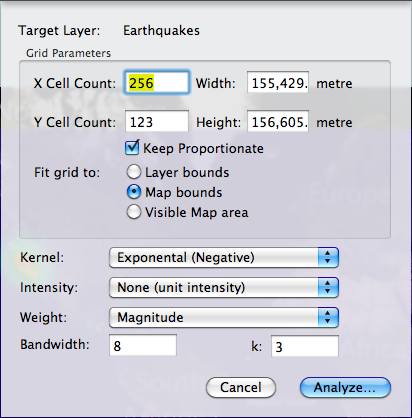
You can see in the screenshot below that the weight of the large earthquake in the Philippines created hot spots that were not on the previous map.