- Thu 20 May 2010
- Tips and Tricks
- Rick Jones
Cartographica supports many projection systems and now support the ability to add your own unique projection system to the program. The ability to add your own projection allows you to very accurately represent data on a map, which make for more accurate geospatial analysis. Cartographica has supported many projection systems in the past and the ability to add your own projection system gives Cartographica to accurately project data anywhere in the world.
The new projection management features allow you to maintain custom projections in an group labeled User Defined Projections. This group contains all of the projections that you have added to the system and is stored in your preferences, so it is not attached to any particular mapset. Of course, when you use a custom projection in a mapset, it is stored in that file and will travel with the data, making sure that your custom projection is appropriately rendered if you send the mapset file to someone else. Further, if you export to a file format that supports maintaining projections, such as ESRI shape files, those projections are also maintained.
The most immediate use of this feature is to facilitate Cartographica working with data that is brought in from locations and CRSs that don't show up in the basic list inside of Cartographica, even if the data doesn't include projection information. When loading these files into Cartographica, they most often show up with their Projection as "Unprojected". In this case, Cartographica attempts to use the coordinates in the Map Projection. Often, this just works, as projects often contain data in only one CRS. However, when using the new Live Maps function, it's desirable to use projections such as the world-wide pseudo-Mercator, which is a good viewing format for large distances, but doesn't tend to be used for data storage and acquisition. Thus, it is increasingly important to have each layer's projection set correctly, so that Cartographica can handle lining up all of the layers when using these formats.
Another interesting use of this feature is the creation of custom projections. In the case of projections that are used mostly for visualization, such as the Hotine, Perspective, and Orthographic projections, the attributes of the projections vary greatly depending upon the parameters, such as the center point. For these projections, we have always included a small number of examples, but until now there was no way to manually adjust them to your needs. Now, it's possible to create a series of highly-specialized projections that do exactly what you need.
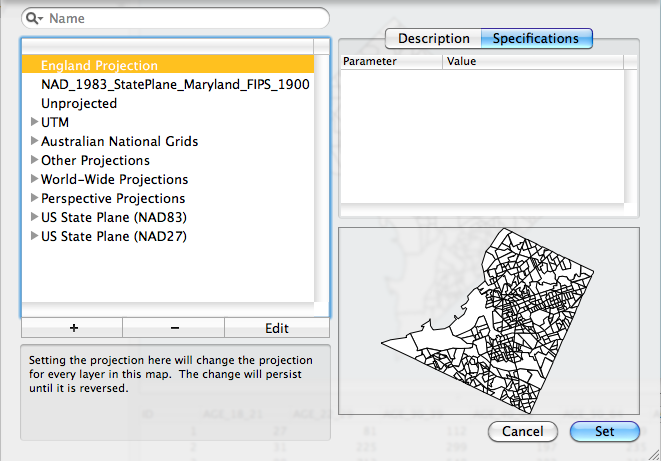
The enhanced projection management system in Cartographica supports prj, wkt, or text files containing information in WKT, ESRI WKT, or Proj4 format by simply dropping the text into the Project Map or Set Layer's Projection window. These file types are mark-up languages that allow users to both define and redefine projection geometry. The example that follows uses an example of a WKT project that was collected from Wikipedia and is a projection system for England. The data being used in the example is from Washington D.C., and we will see how the England projection is not a good fit for our data.
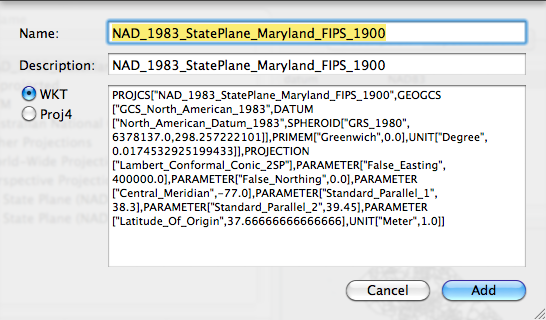
Further, projections can be edited directly using the +, -, and Edit buttons at the bottom of the list. These provide for fine-grained control of the projection by allowing you to edit the projection in its native PROJ4 or WKT form. Although not very difficult, an understanding of the meaning of the parameters is necessary in order to get good effects from this process. You will note that if you click on the Edit button while a system projection is selected, a new copy of that projection will be created for you to edit. For those who are interested in tweaking particular parameters and who are looking to understand the Proj4 format better, there's a detailed article on Proj4 General Parameters at the OSGeo web site that is the home of Proj4.
-
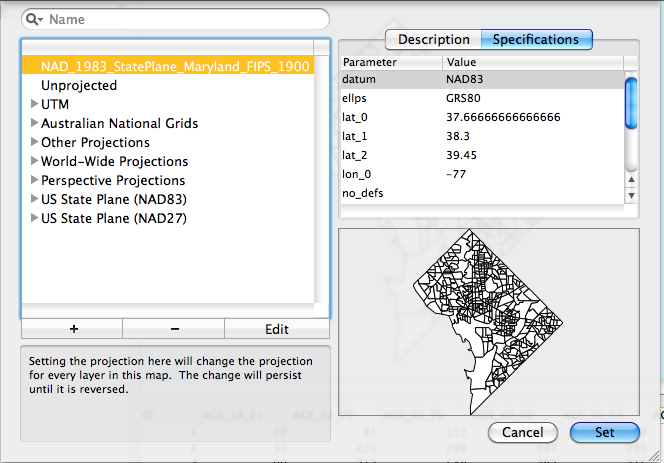
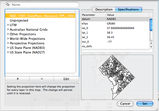
Projection Window: Notice that the preview window shows an accurate depiction of Washington D.C.\
-
Click on the "+" button to add your own projection\
-
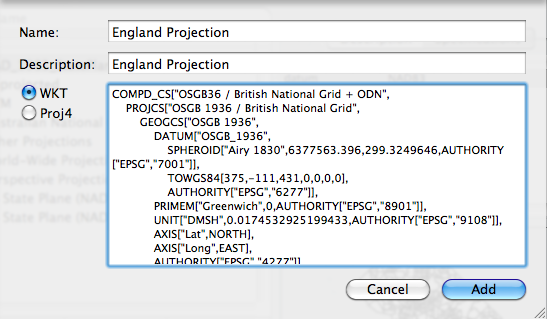
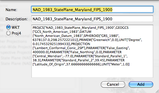
Edit the information in the New Projection Window...now paste the example WKT text from Wikipedia into the Text Window\

-
Notice that the Preview Window now shows an inaccurately projected map of Washington D.C.\