- Wed 14 March 2012
- Cartographica
- Rick Jones
- #analysis, #crime, #kernel density
Washington D.C. has an excellent catalog of GIS data that is made available to the public at DC GIS. The website provides data on all sorts of issues ranging from criminal activity to building permits. Also the website contains spatial files that can be used to create detailed and professional maps. For this post I collected data on 2011 crimes within the city. I will show how to import the data into Cartographica, how to geocode the crime incident data, how to search for specific types of crimes, and how to create Kernel Density Maps.
The first step in this process is downloading the data. Go the to link above for DC GIS and download the Crime incidents (ASAP) 2011 data. This file contains all of the crime incident reported in DC during 2011. Once you download the file save it.
Before we import and geocode the data we need to add a live map to use as a basemap. To add a live map choose File > Add Live Map.
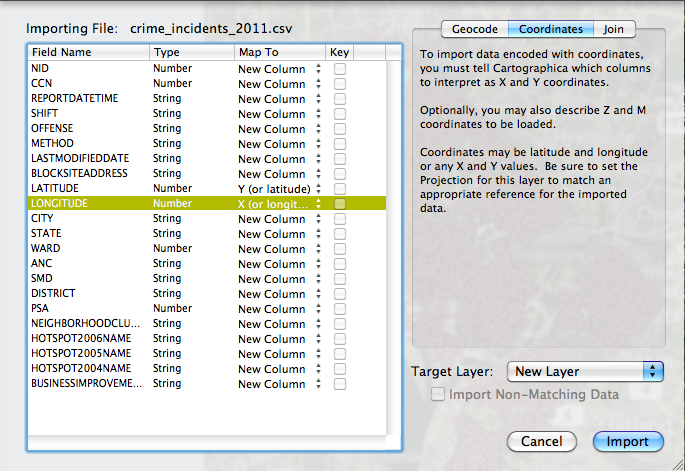
Next, we need to import the file into Cartographica by choosing File > Import Vector Data. This will bring up the Import File Window. Here we are going to geocode the crime data. To geocode the crime data select the Coordinates tab in the top right of the window. Next, change the "Map to" selections for the Latitude and Longitude row to Y (or latitude) and X (or longitude). Finally, click on the Import button. I provide an image of the import file window below.
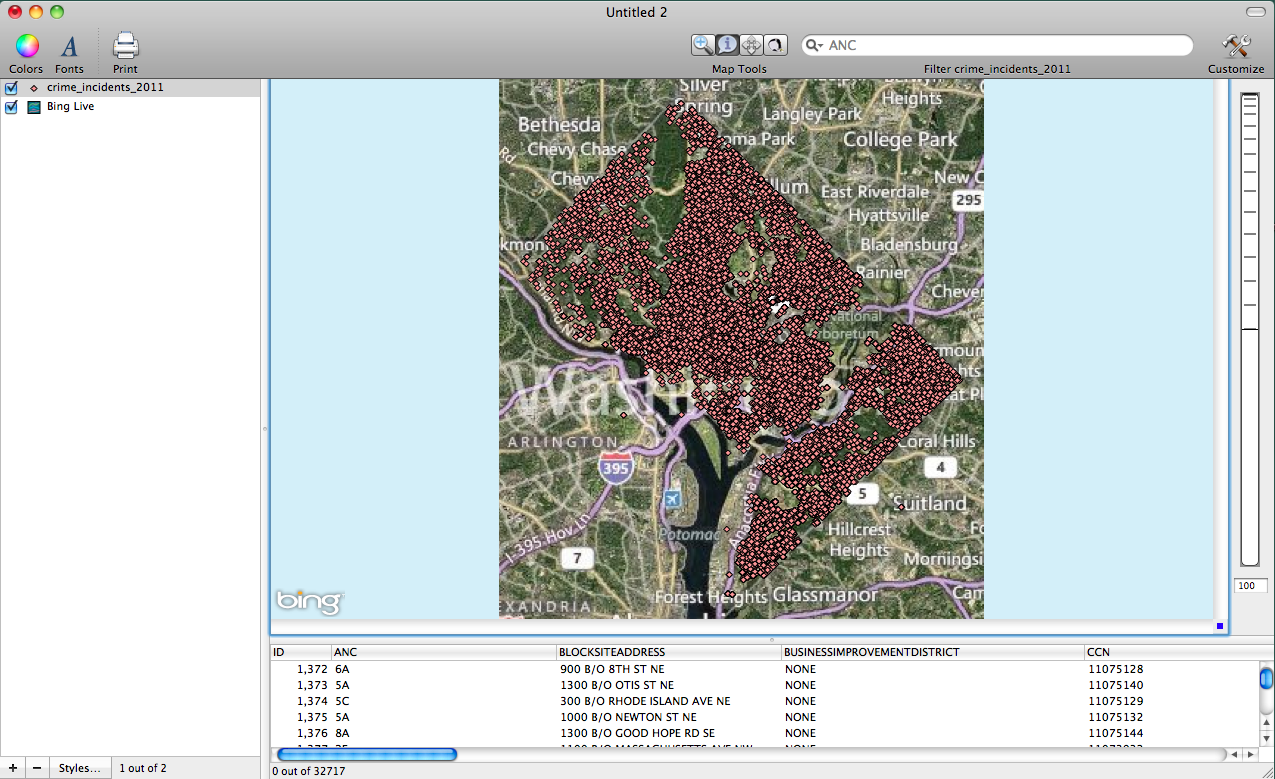
After the data are geocoded you will notice that there are a few crimes that are incorrectly geocoded outside of the city limits of DC. To correct this problem we are going to delete the incorrectly geocoded points. To do this use the identify tool to select the points then choose Edit > Delete. When you are done deleting the points you should have a map with only points inside of DC. I provide an image below to show you what your map should look like.
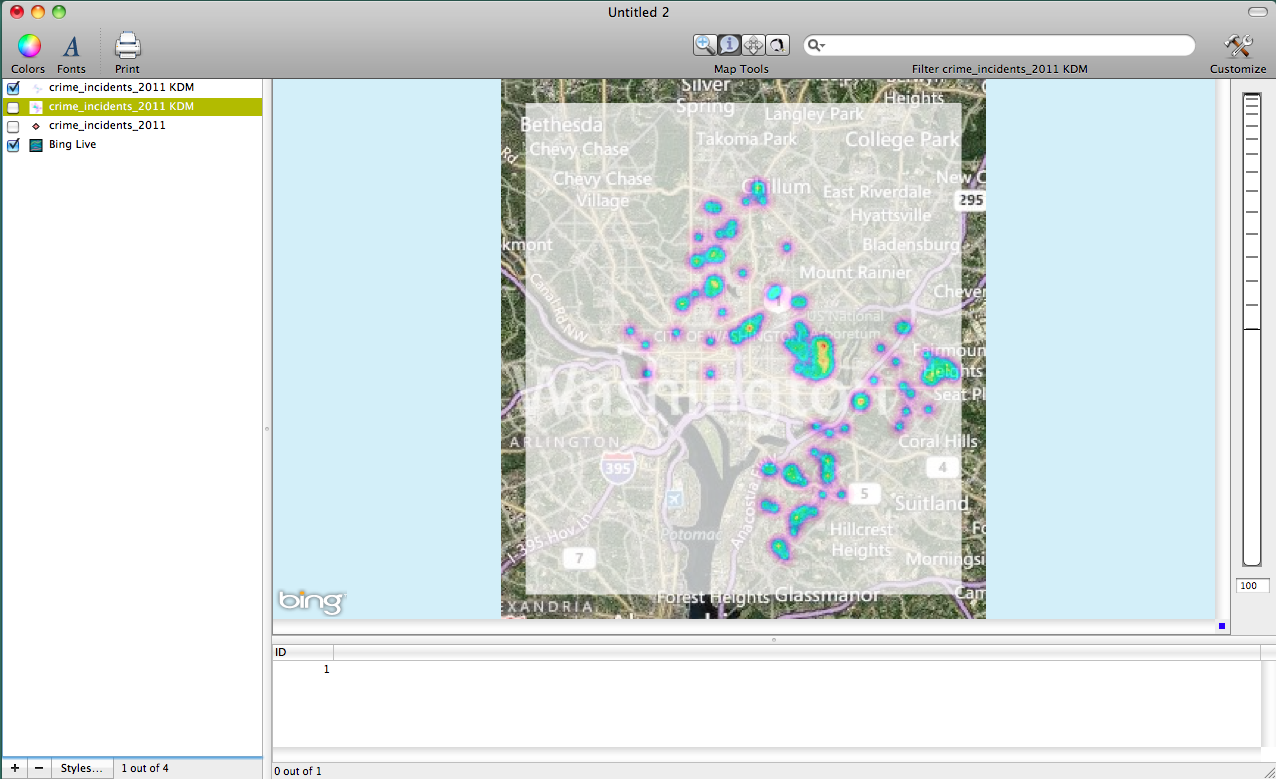
To get a better idea about where crimes are concentrated lets create a Kernel Density Map. To create a KDM, hold down the option key and choose Tools > Make Kernel Density Map… Select the Exponential (Negative) kernel option and then click on the Analyze button. (Note: you can change the layer opacity by double clicking on the KDM map in the Layer Stack and then moving the opacity slider. Also you can change the color of the KDM by choosing Window > Show Color Palettes and then drag the color to the color ramp in the Styles Window for the KDM map). I provide an image below of the KDM Map. Note: I unchecked the crime_incidents_2011 point layer to create the image.
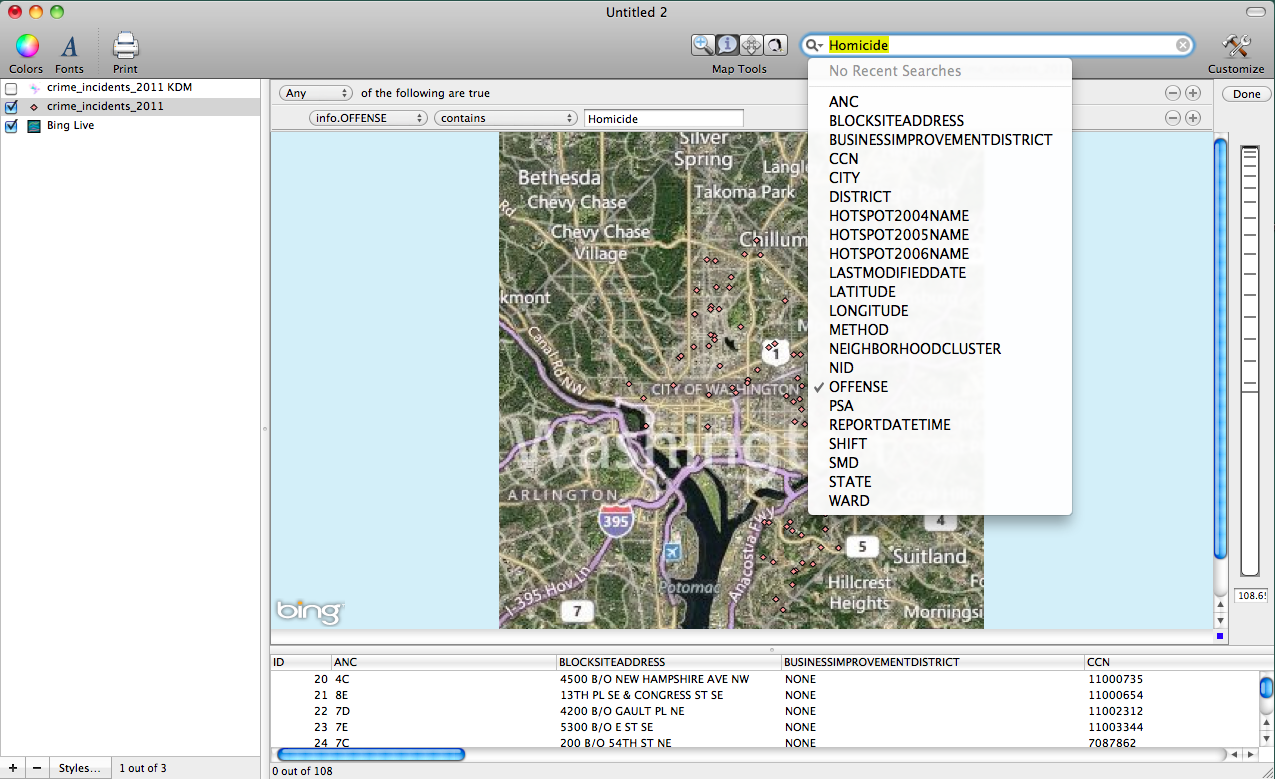
Next, we can limit the types of crimes visible on screen by using the Search bar in the top right of the Cartographica window. First, uncheck the KDM map that we just created. Next, check the crime_incidents_2011 point layer in the layer stack. With the crime_incidents_2011 point layer still selected in the layer stack click on the Magnifying glass within the search bar and then select the Offense category then type Homicide into the search bar. This will change the points visible on the map to only those classified as homicides. The data viewer window at the bottom of the Cartographica window should show that there were 108 homicide in D.C. during 2011. I provide an image of the search bar below.
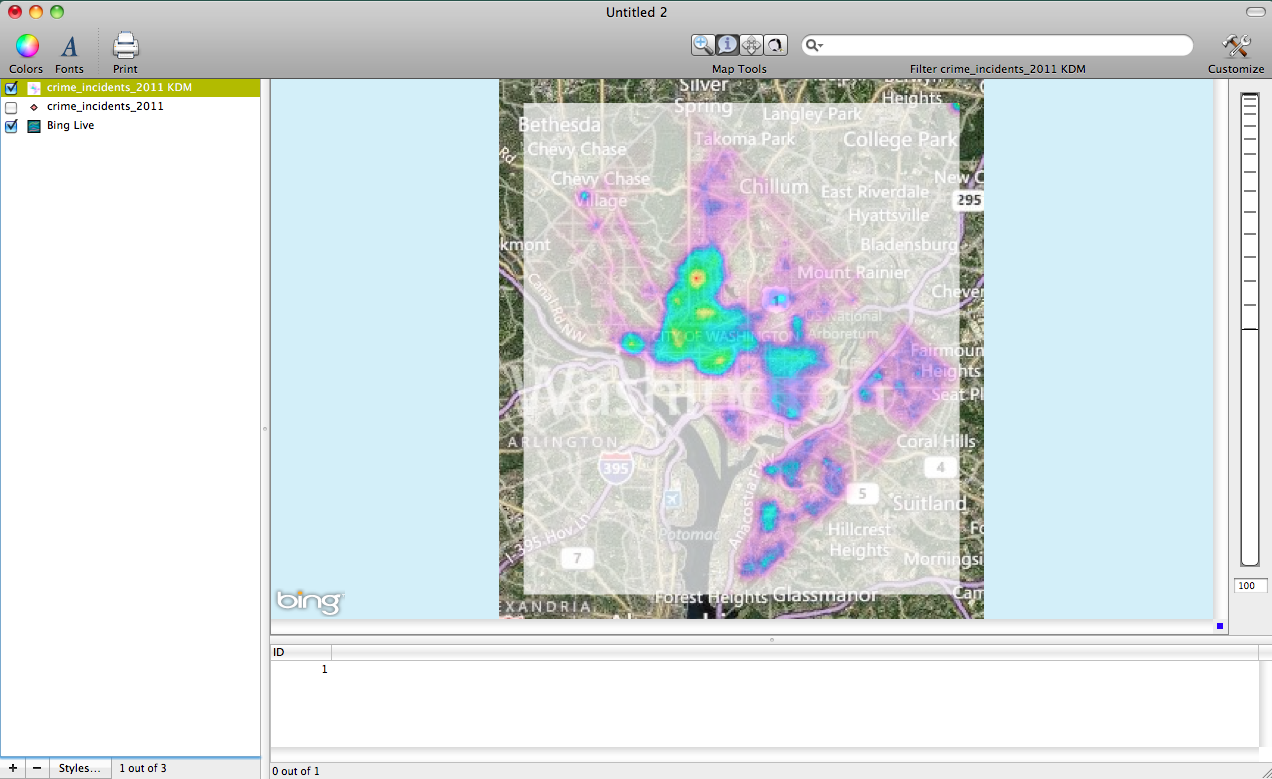
To create a KDM of the homicides select the identify tool and then draw a box around all of the homicide points. You can check that all of the points are selected by looking at the bottom of the Cartographica window. You should see 108 out of 108. Next, hold down the option key and choose Tools > Make Kernel Density Map for Selection. Change the Kernel to Exponential (negative) and then click on the Analyze button. One of my favorite features about Cartographica is that in order to make the layer opacity of the homicide KDM match the all crimes KDM all we have to do is drag the all crimes KDM layer onto the homicides KDM layer in the Layer Stack. This will exactly match the layer opacity used for the homicide KDM to the all crimes KDM. This is a simple feature but it can really be a time saver and make multiple maps more easily comparable. To change the color scheme choose Window > Show Color Palette and then choose the color palette you want to use and then drag it to the homicides KDM layer in the Layer Stack. I provide an image of the Homicide KDM map below.