- Tue 24 May 2011
- Cartographica
- Rick Jones
On April 27th 2011 Tuscaloosa, Alabama was hit with an EF-4 tornado that had winds at nearly 200mph. According to the National Weather Service the tornado was at least a mile wide and stretched nearly 80 miles in length. Tornado warnings were in effect between 3:40 and 8:00pm. The number of fatalities within the city of Tuscaloosa was staggering as it was last reported as 41 the Tuscaloosa News
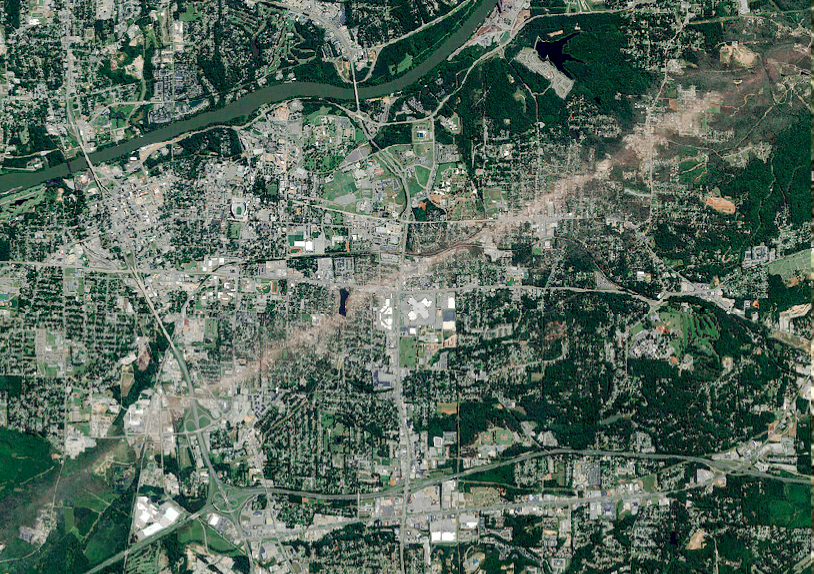
In order to highlight the path of devastation of the tornado I obtained a satellite image from Public Intellegence The image shows the path of the tornado, which I used to create a more interesting map in Cartographica.
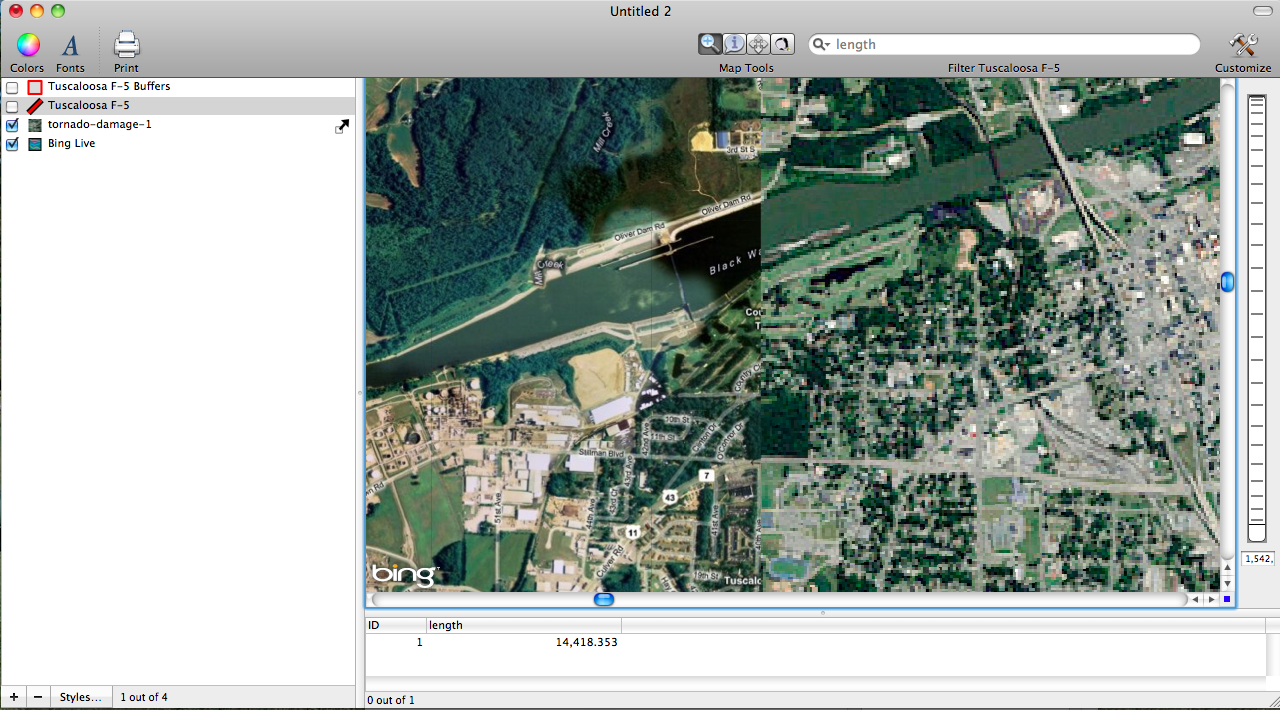
The first step after downloading the image is getting the image correctly georeferenced. Cartographica makes this easy. The best way to do this is to identify several landmarks on an already georeferenced layer. In Cartographica we can simply use the Live Bing Map that can be turned via he File drop down menu. Below are a couple of images showing the process of matching the land marks from the Downloaded image to the Bing Map.
Next, I created a new line feature that closely tracts the path of the tornado as it appears in the satellite image.
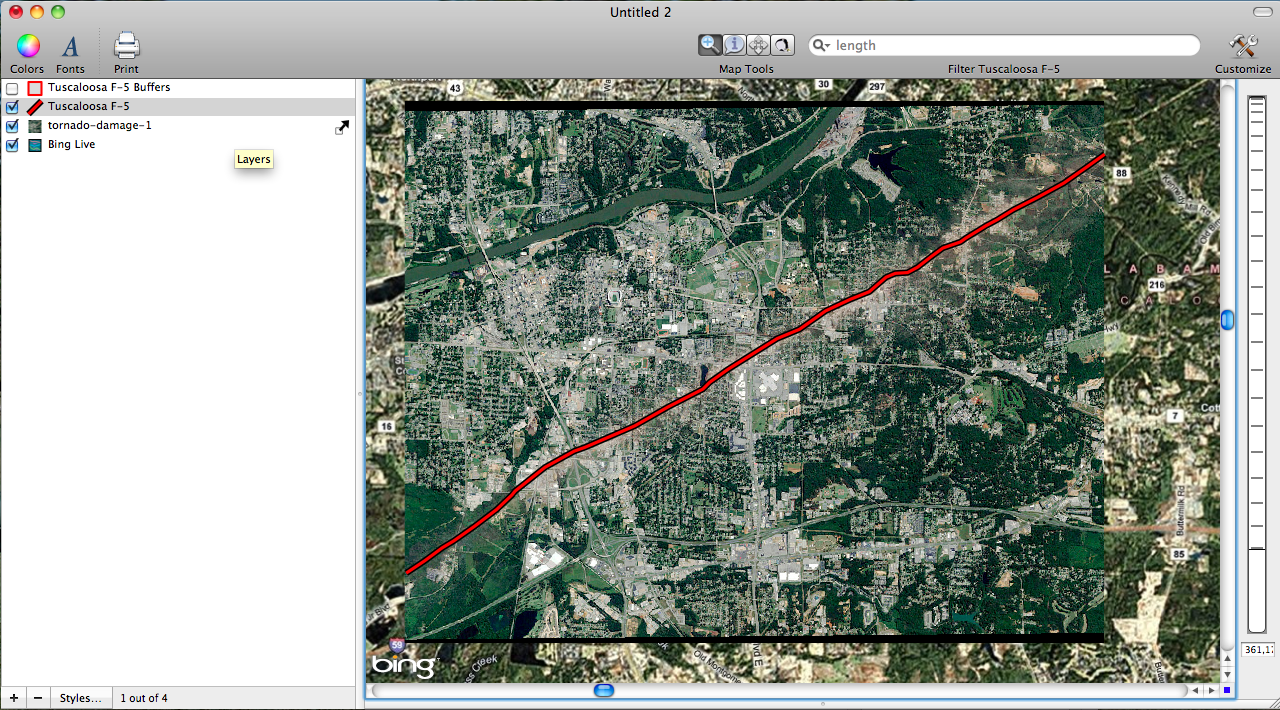
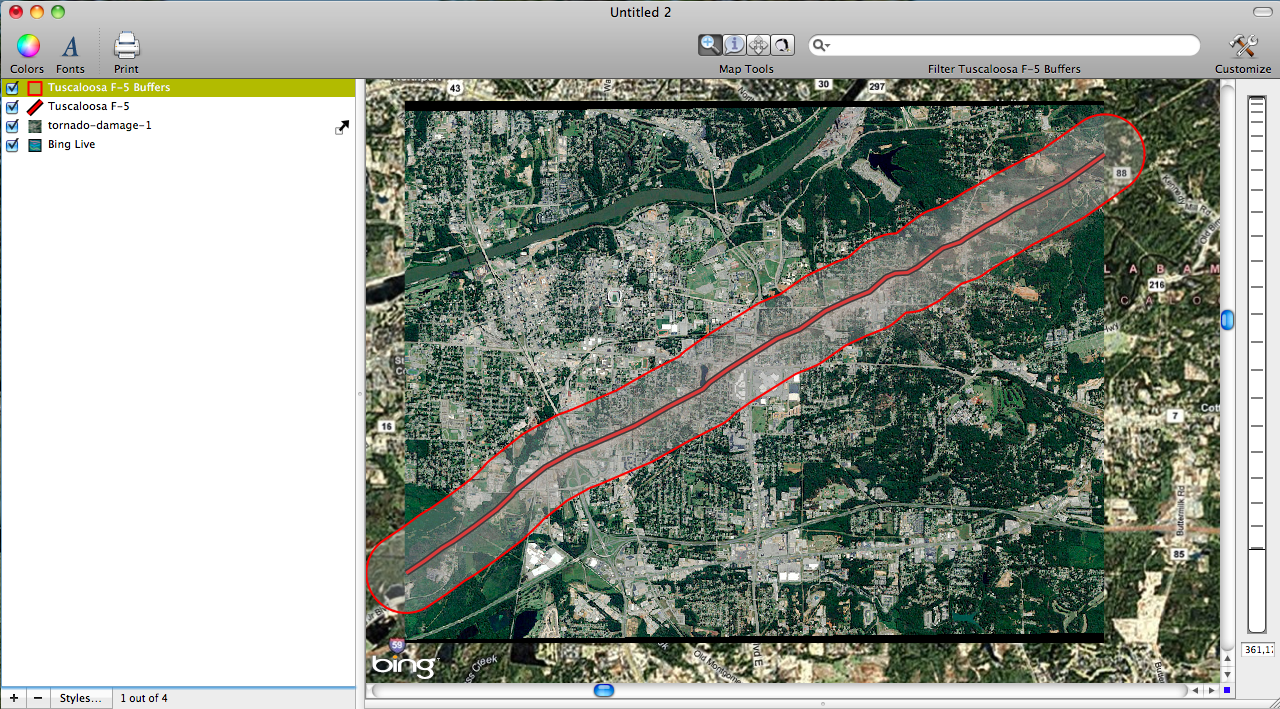
Based on reports from the National Weather Service the storm was nearly a mile wide. To highlight this width on the map I created a .5 mile buffer around the line layer that shows the path of the tornado. The image of the tornado path and the one mile wide destruction ban is shown in the following image.
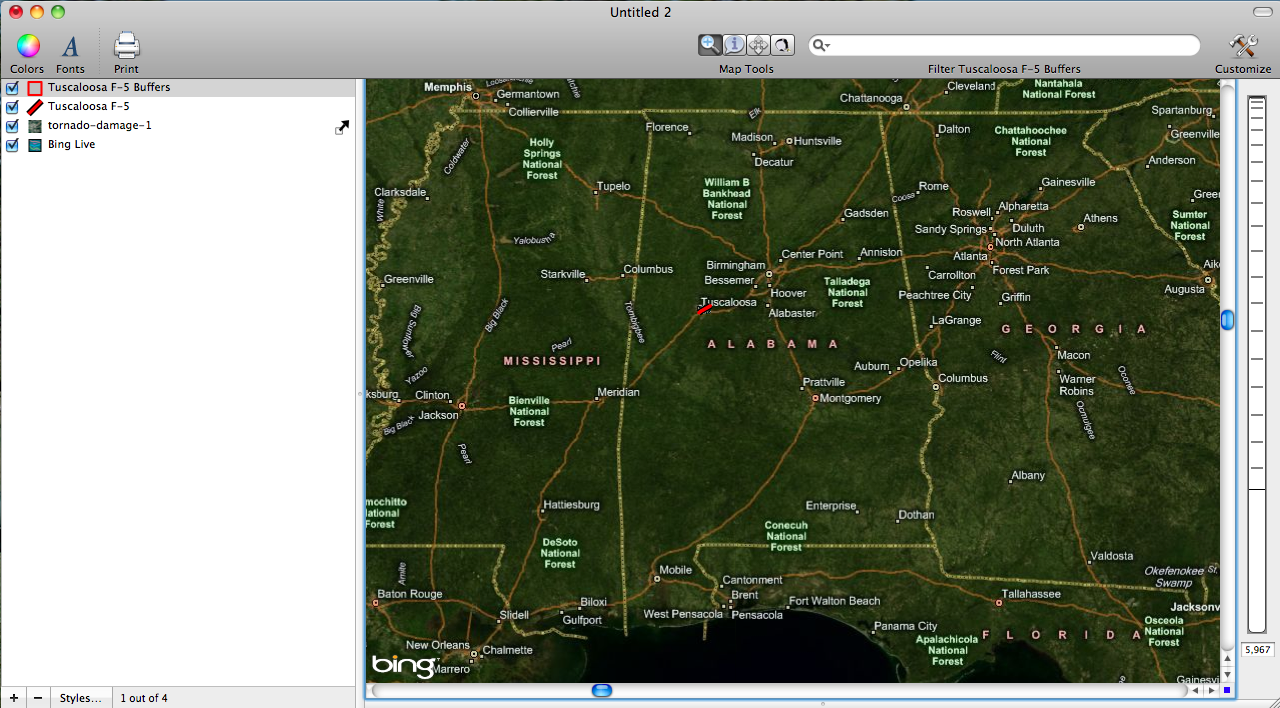
The final image provides a little more context about where tornado was located within the state.