- Tue 14 June 2011
- Cartographica
- Rick Jones
ColorBrewer is a free online database of color palettes that are designed to be used with GIS. The website allows users to select from a variety of colors that have been pre-selected and formatted for both quantitative and qualitative data. In this post I will show you the steps for quickly bringing ColorBrewer color schemes into Cartographica.
Cartographica can accept palettes directly from the ColorBrewer site for use in the Color Palettes Window. Although we specifically point at ColorBrewer for good palettes, Cartographica can import any combination of numbers where the Red,Green, and Blue components are separated by commas and have a range of 0-255 and where colors are separated by semicolons.
The steps in the process are...
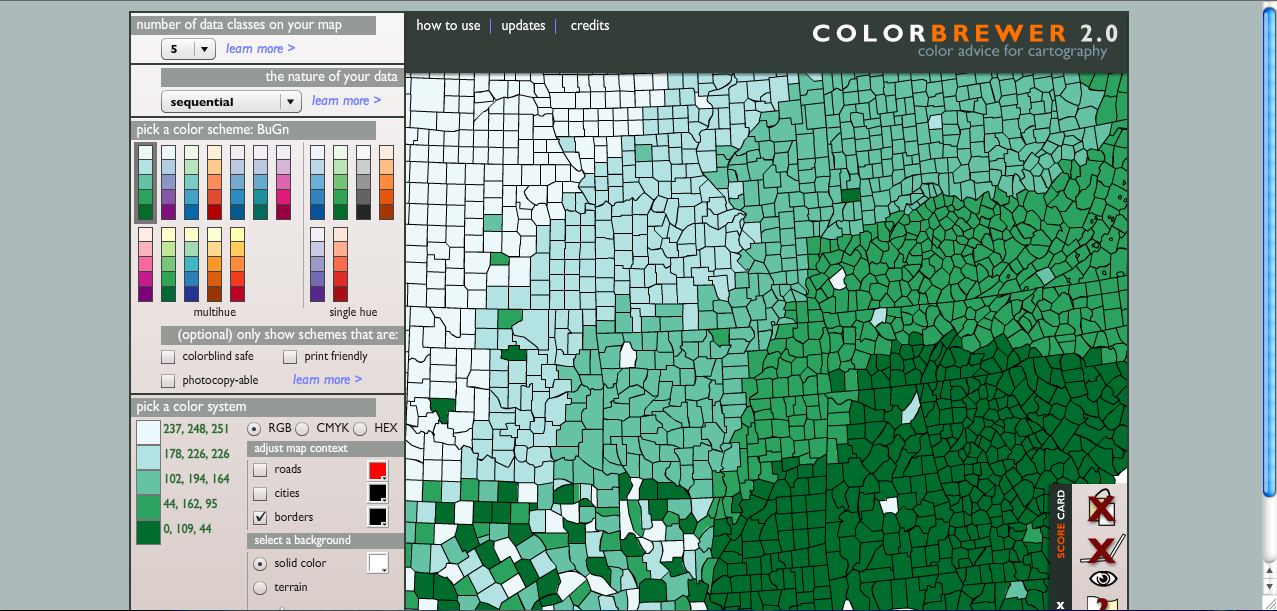
- Visit the ColorBrewer site to compose your palette.
- When you are done creating your palette, click Export Your Colors to bring in the export window. Notice in the Simple Copy-n-Paste in the bottom right of the export window.
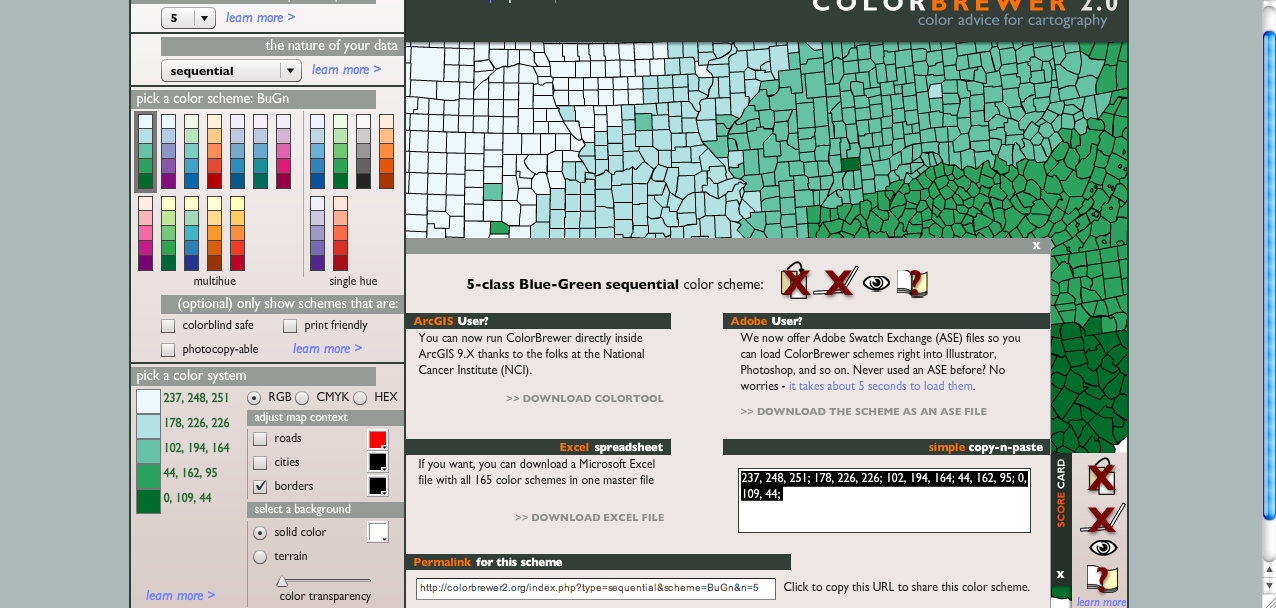
-
Copy the numbers in the box or just copy-n-past
-
Switch back to Cartographica.
-
Choose Window > Show Color Palettes to bring up the Color Palettes Window.
-
Choose Edit > Paste to paste the palette into your Palette Window
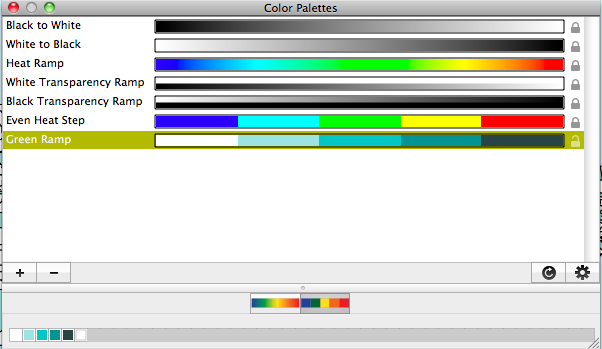
- Rename the color palette by clicking on the name and typing a new one.
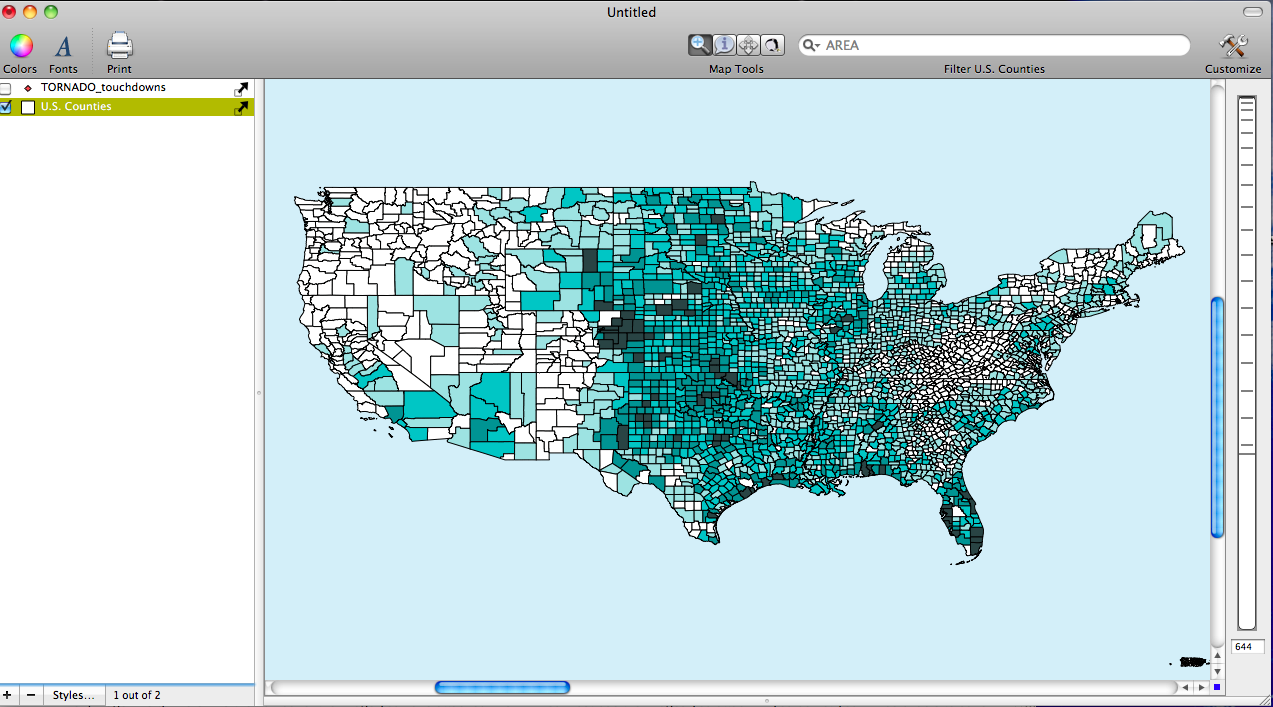
The image below shows the Layer Styles Window (On left side of screen) and the Color Palettes Window. In order to change the Color Palette of the data we wish to display drag and drop the new color palette onto the central window of the Layer Styles Window
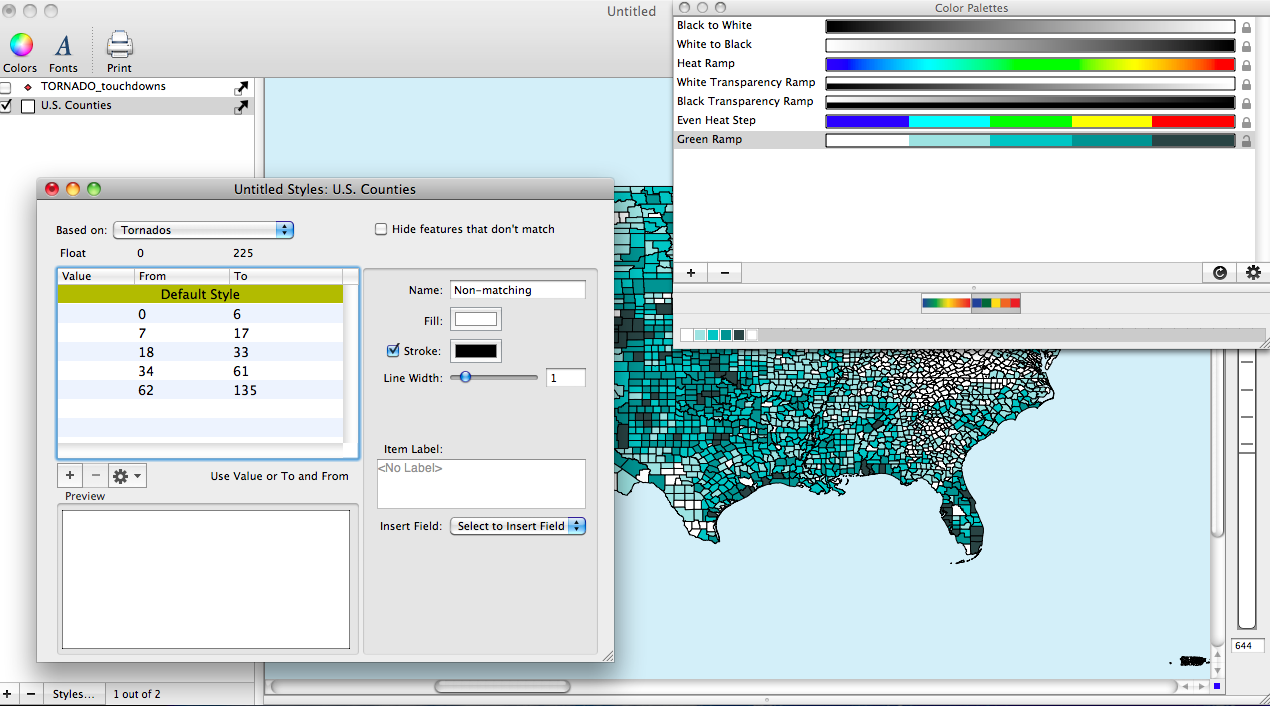
The image below shows a county level data set for the United States. The data being displayed are the number of tornados that have been recorded in the counties since 1950. The number of tornados was originally imported as a point file but was easily aggregated to the county file by using Cartographica's Count Points in Polygons tool.