- Tue 12 July 2011
- Cartographica
- Rick Jones
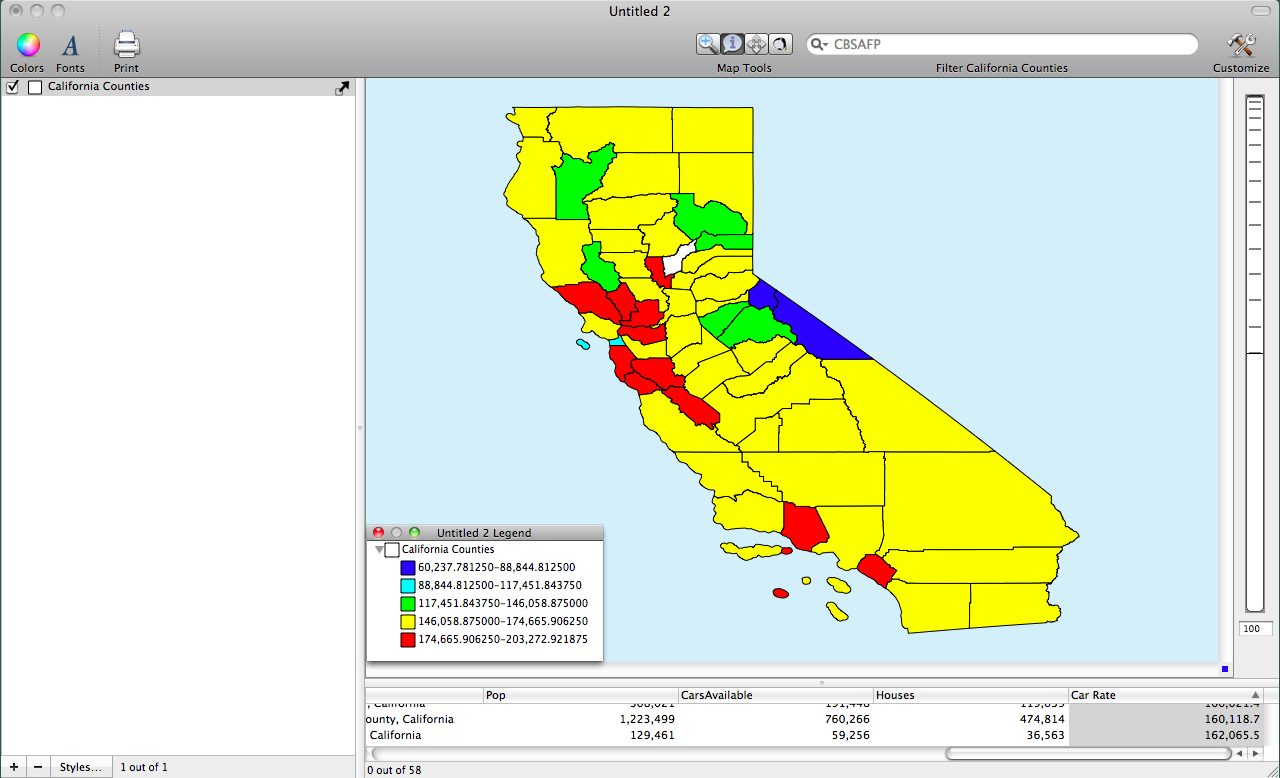
Rates are useful when we need to compare geographic units that have unequal distributions of population. For example, if we wanted to compare car ownership for two California counties, say, Los Angeles County and Fresno County we would want to take into account the populations of each county. If we did not take into account the population then we might conclude that people in Los Angeles are more likely to own cars than people in Fresno. However, it is possible that this is not the case. It may be that the density of car ownership is much higher in Fresno County than it is in Los Angeles County. In the following text I highlight how to create rates in Cartographica and I show you where to find GIS data to practice with.
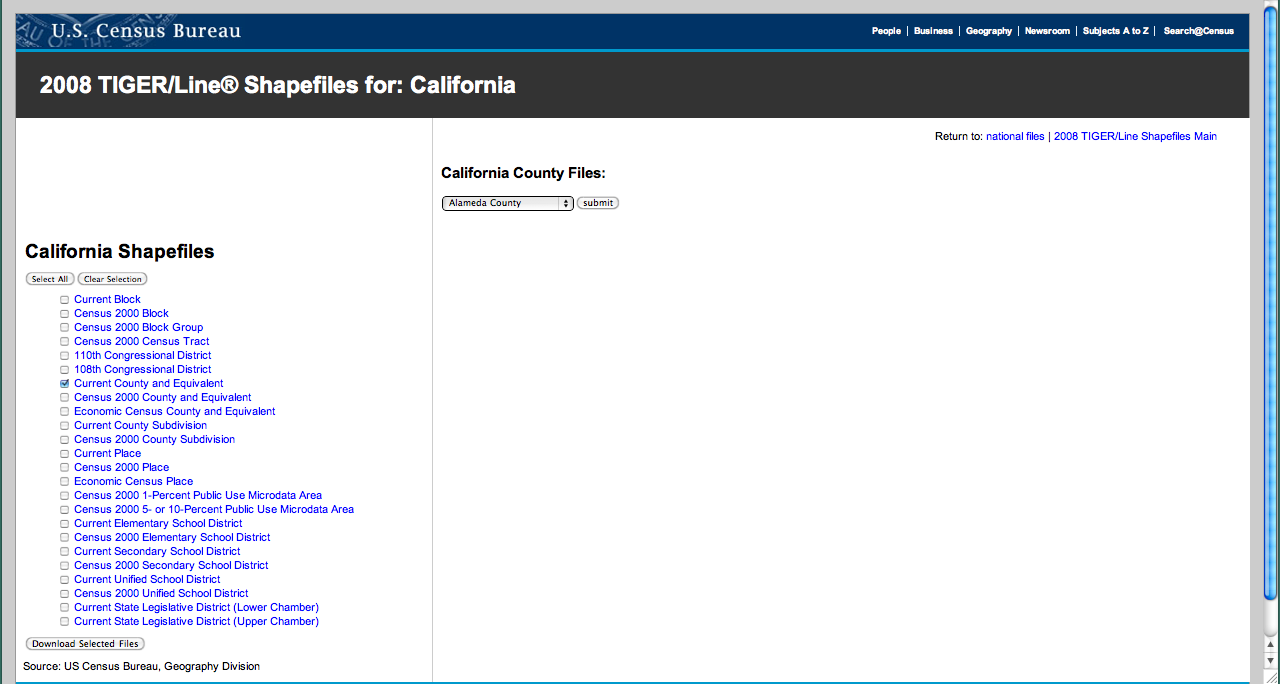
The county geographic data being used in this post was collected at the U.S. Census Bureau website for 2008 California Shapefiles. I clicked the box next the " Current County and Equivalent" file and then "Download Selected Files" This allowed me to download the boundary files for all of the California counties.
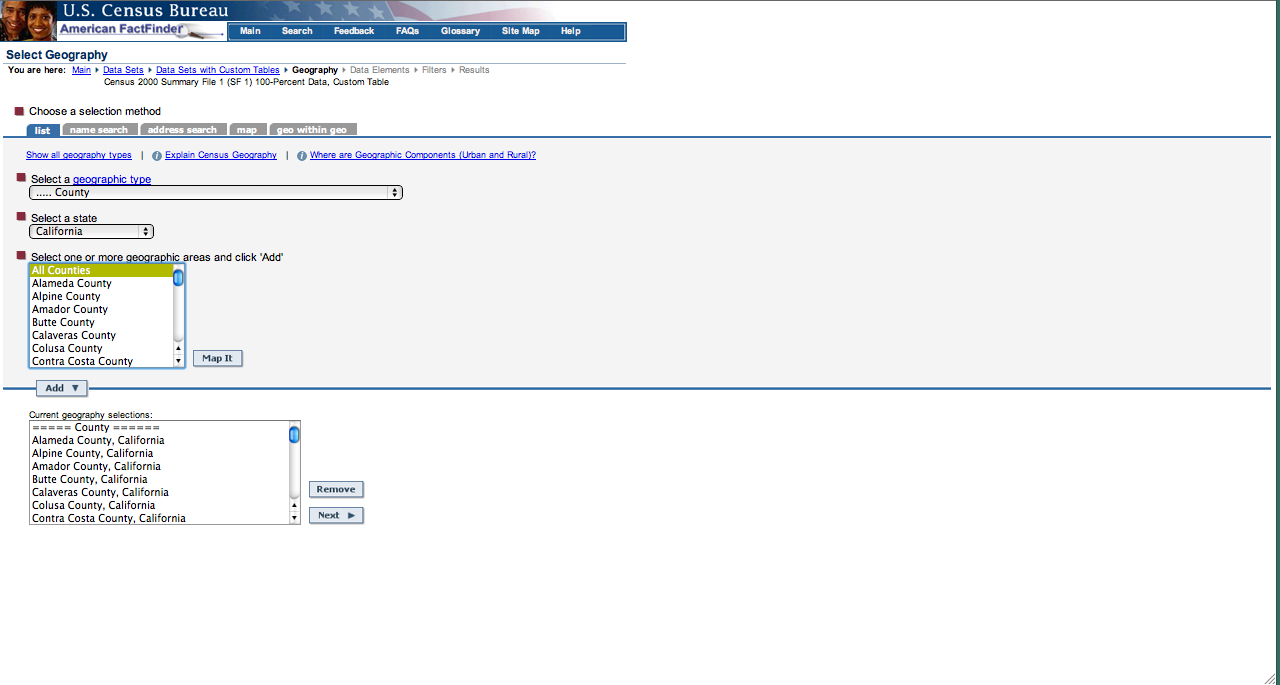
Next, I downloaded 2000 U.S. Census data for each of the counties in California. I downloaded data for the aggregate number of households that have at least one car available. In order to calculate the rates I also needed the total number of households. The data are downloaded in .xls form, which can be converted to a .csv and then joined to the county level geographic file.
I then joined the .csv data to the geographic county file to create a shapefile that contains both spatial and attribute data.
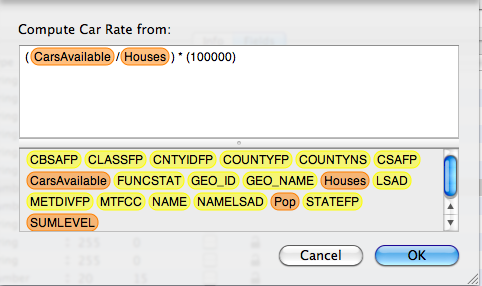
Next, in order to make rate comparisons between counties I calculated the rates for the number of cars per household. To calculate the rate click on Window > Show Layer Info > Click the Field tab. The next step is two-fold. I clicked the "+" button to add a new column to the California counties shapefile, and then renamed the new column Car Rate.
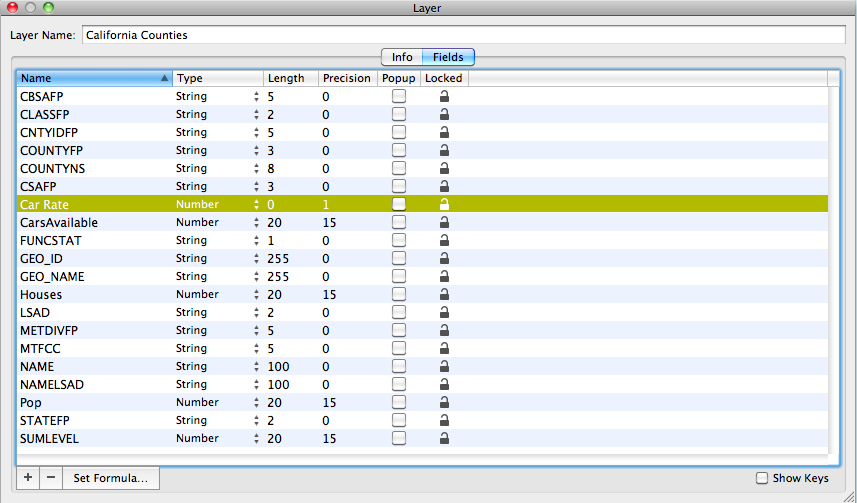
Next to determine how the column will be calculated I clicked the "Set Formula" button...this will bring up the compute columns window which allows you to drag and drop variables into the window. Then you can input mathematical operators that will calculate the rate. To calculate the rate of cars per household I divided the aggregate number of households with at least one car available by the total number of households and then multiplied the quotient by 100000.
Finally, I can distribute my new rates by using the layer styles window and Cartographica's sleek color schemes.