- Wed 25 July 2012
- Featured Maps
- Rick Jones
- #Cartographica
The 2012 summer Olympics in London, England are here, which is very exciting for many athletes and fans of sports from across the globe. This year's Olympics will host athletes from more than 200 countries and will consist of nearly 40 sports. The games will run from July 25 - August 12; for a schedule of the events take a look at the schedule on the official Olympics website. To celebrate the diversity of the event we decided to build a dataset that contains the countries participating in the Olympics along with the number of athletes from each location.
The first step in mapping the distribution of Olympic athletes is collecting a shapefile that contains all of the world's countries. To download a World shapefile go to this Geocommons webpage and click on the shapefile download button on the right side of the page. The file should only take a few seconds to download. Once downloaded save the file to your desktop.
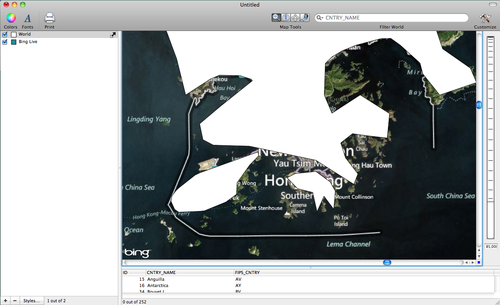
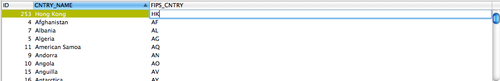
To import the downloaded World shapefile choose File > Import Vector data. One problem with the World shapefile is that Hong Kong is included within China. In the 2012 Olympics Hong Kong is independently represented by more than 40 athletes. This problem is easily fixed by using the Add Feature tool in Cartographica. Zoom in to the area of China that contains Hong Kong. If you unfamiliar with where exactly Hong Kong is located use the Live Map Feature to locate Hong Kong. To add a live map choose File Add > Live Map (select Bing Maps with Roads and Aerial Imagery). Locate Hong Kong (its in Southern China, along the coast), and then zoom in. See my image below of Hong Kong.
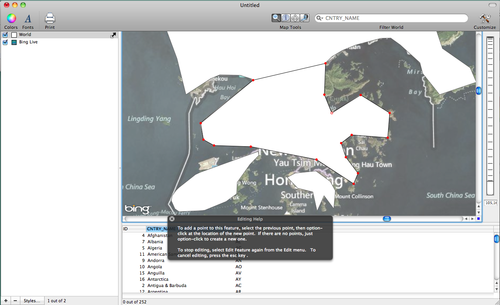
To add Hong Kong to the World shapefile select the World shapefile in the Layer Stack and then choose Edit > Add Feature. Cartographica will enter Edit mode and will allow you to draw in the boundary for Hong Kong. To draw in the boundary hold down the option key and click to place control points. First Draw the boundary around the largest (non-island) area. After the points are placed hit the return key. See my image below for an example.
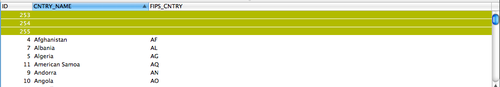
Because there are two islands included in Hong Kong we need to create two new features for each island with the ultimate goal of merging the three new features into a single feature. Using the same methods as above add the two new features. Notice in the data viewer there are now three new features. See the image of the data viewer below.
To merge the three features select each one as shown above in the data viewer, and then choose Edit > Merge Selected Features. The three features should collapse into a single feature in the data viewer, and when selected the two islands should be included in the new Hong Kong feature. To complete the addition of the new Hong Kong feature you can manually add the appropriate data into the data viewer. See my image below for the added data.
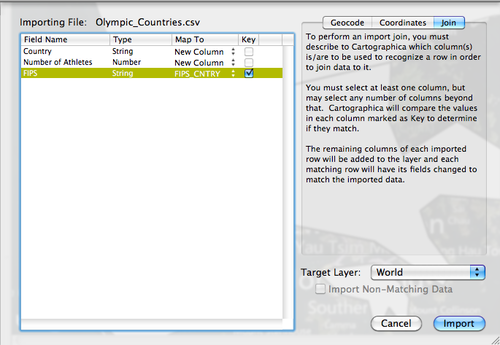
To continue to follow along with the blog, Download the Olympic Athlete dataset. After it is downloaded save the file as a .csv file. Join the Olympics dataset to the World shapefile by choosing File > Import Table Data. This will bring up the Import File Window. Click on the Join tab in the top right pane, change the Target Layer to World, in the left pane, change the Map to option in the FIPS field to FIPS_CNTRY, and check the Key box. When ready click Import. The final dataset will then include the original data from the World file from geocommons and it will also include the data imported from the Olympic dataset. As a result, there will be two country name columns (one from both files), the FIPS_CNTRTY column (from geocommons), and the Number of Athletes column (from the Olympic file). There are two country name columns in the final dataset because the geocommons and Olympic files each included a "country name" column that was not used in the joining procedure. The FIPS column from the Olympic dataset is not imported because the FIPS column is used to match to the FIPS_CNTRY column from the geocommons World file. Since the Olympic data are imported based on the identical match between the FIPS column and the FIPS_CNTRY column, it follows that if the FIPS column was imported it would be an identical match to the data in the FIPS_CNTRY column.
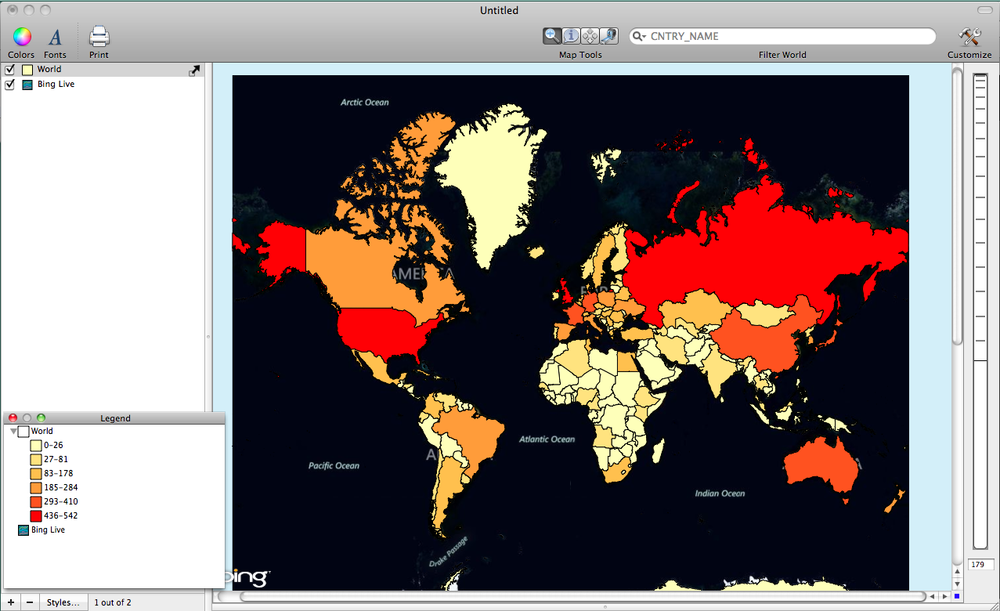
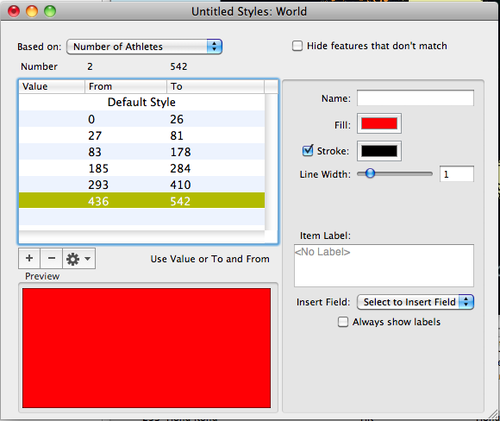
You can create a choropleth map of the distribution of Olympic athletes by double-clicking on the World layer in the Layer Stack. Change the Based on menu to Number of Athletes, Click on the + button five times to add five categories, and then click on the Gear box and select Distribute with Natural Breaks (Jenks). To add a color scheme choose Window > Show Color Palettes and then click and drag a color scheme into the table within the Layer Styles Window. I provide an image below of the Layer Styles Window.
The next image shows the distribution of athletes from across the globe. To add the Legend in the bottom choose Window > Show Legend.