- Fri 02 March 2012
- Cartographica
- Rick Jones
- #formula, #label, #politics
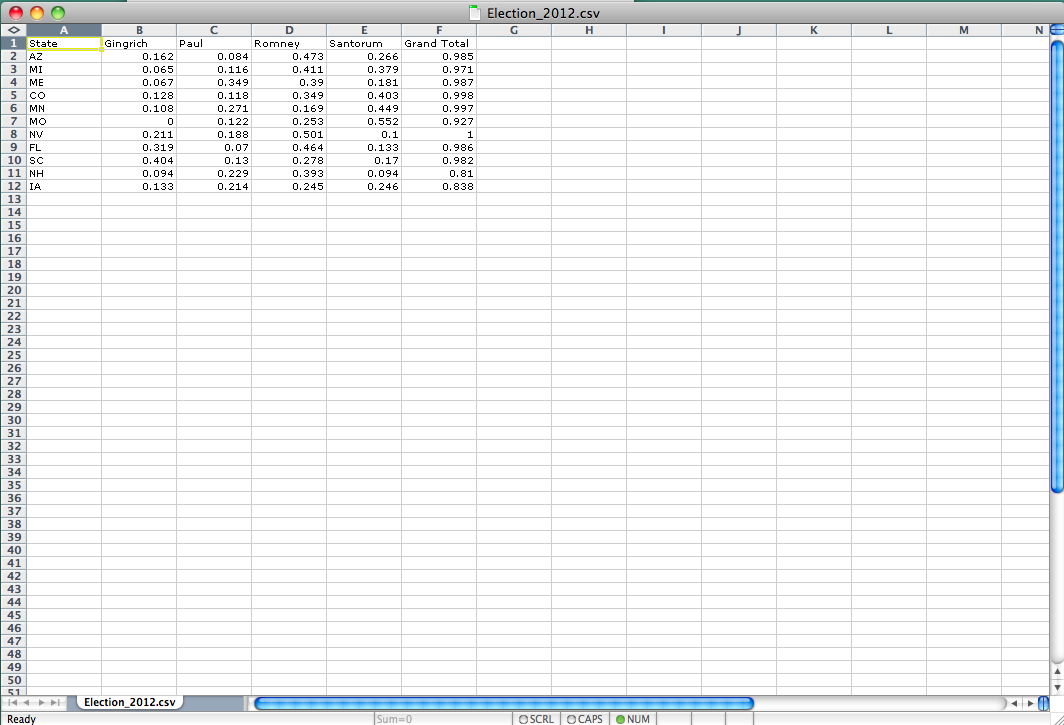
The U.S. Republican Presidential Primaries are still ongoing, but a number of states have already completed their elections. To find election results do a google search for 2012 primary results or click here. The first search results should be a table of data with the percent voting for each of the major candidates in each state. I wanted to create a few maps to show the results. I quickly created a .csv file by copy and pasting the table into my spreadsheet application. I saved the file as Election_2012.csv. I provide an image below of what the dataset should look like.
Next, the data are provided at the state level so I needed a map of U.S. States. You can find a U.S. States map here. After you download the States shapefile import it into Cartographica by choosing File > Import Vector Data
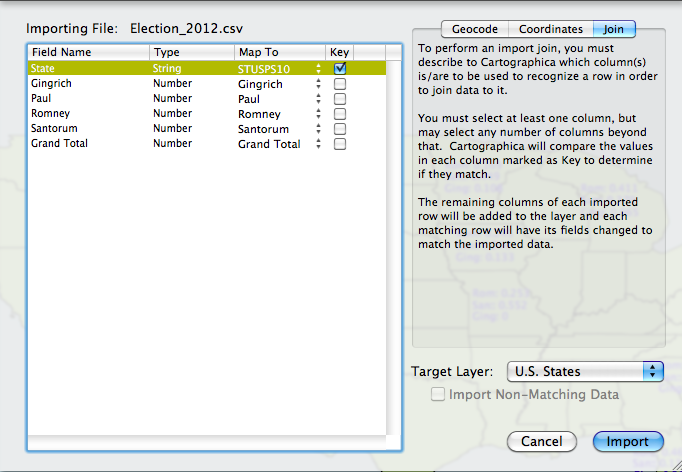
Next, we can join the Election_2012.csv file to the states file by choosing File > Import Table Data. Select the join tab in the top right of the Import File Window. Change the Target Layer menu to U.S. States. Change the Map to option to STUSPS10. Once complete click on the import button. I provide an image of the set up below.
Because the data are in decimal form we may first want to convert the numbers to percentages. To create new columns that contain percentages we can use the Layer Info Window. Open the Layer Info Window by choosing Window > Show Layer Info. Click the + button four times to add four new columns, one for each candidate. Next, rename the new columns Per_San, Per_Rom, Per_Ging, Per_Paul. Next, set up the formulas for each of the new columns by selecting the Set Formula button. Set the formula as ("Candidate Layer"*100) to create the percentages for each candidate. Also, be sure to change the layer type from String to Number.
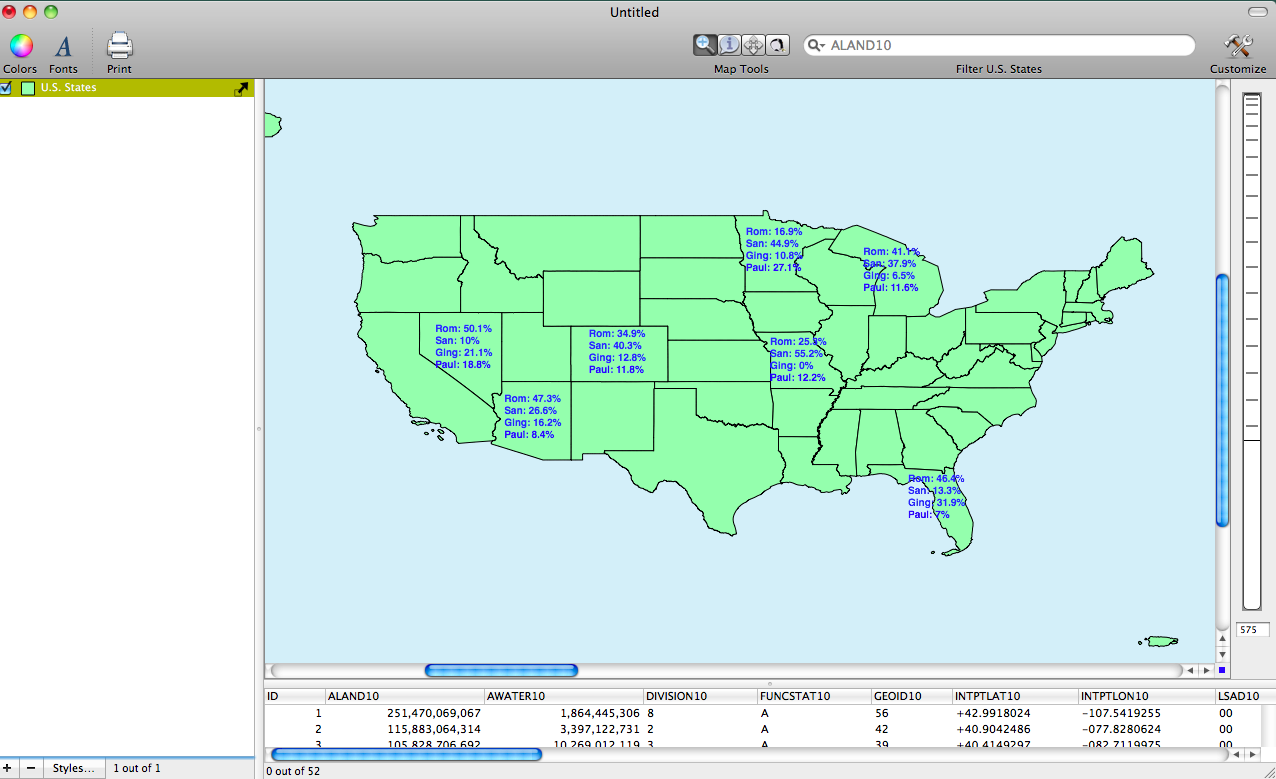
Now that the data are joined we can create maps. Double click on the U.S. States layer in the Layer Stack. I want the individual percentages for Mitt Romney, Rick Santorum, and Newt Gingrich displayed on the map. To do this change use the Insert Field menu in the bottom right to select Romney, Santorum, and Gingrich. This will add their names to the Item Label window. Also type in abbreviations so that we know who each number corresponds to. Notice on the map that the individual percentages for both candidates is shown. The image below shows the set up.
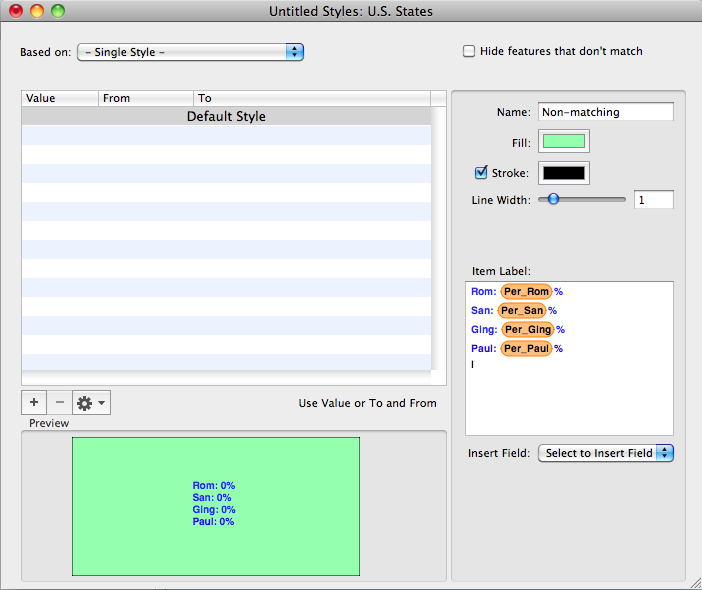
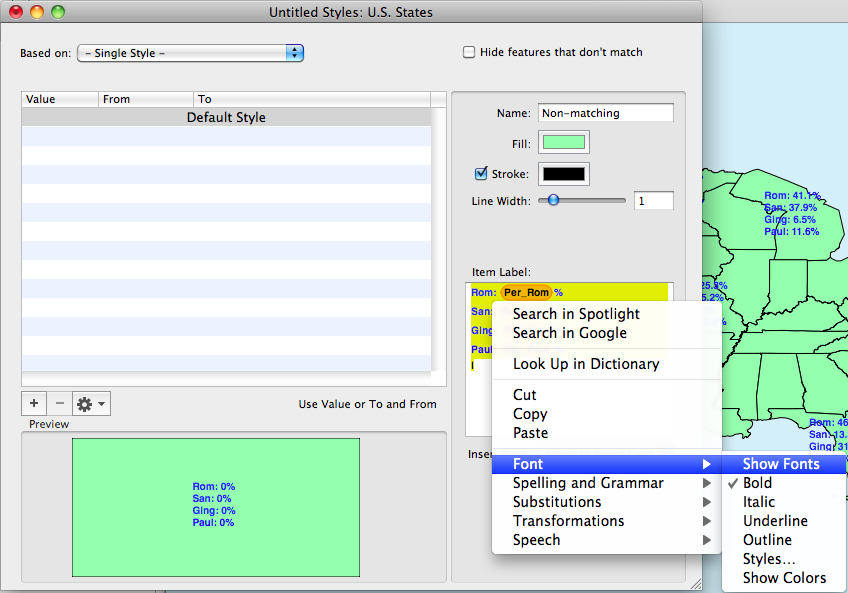
To change the color or font of the the item labels control click to bring up the option window and then change the colors or font style to what you would like to use. This will automatically change what is visible within the map window. I show an image of the option window below.
The final product should look something like what is shown below.