- Thu 16 February 2012
- Cartographica
- Rick Jones
- #choropleth, #internet
A colleague pointed me to an interesting website for the International Telecommunications Union. The ITU is an organization that collects and disseminates telecommunications data. Their website provides information on various topics and also includes access to graphics and free data. On the right side of their main page there is a list of datasets about communication systems by country for years 2000-2010. This is a very nice set of data because the data are time-series, and because the data appear to have few missing values. For this post I downloaded the dataset "Percentage of Individuals using the Internet".
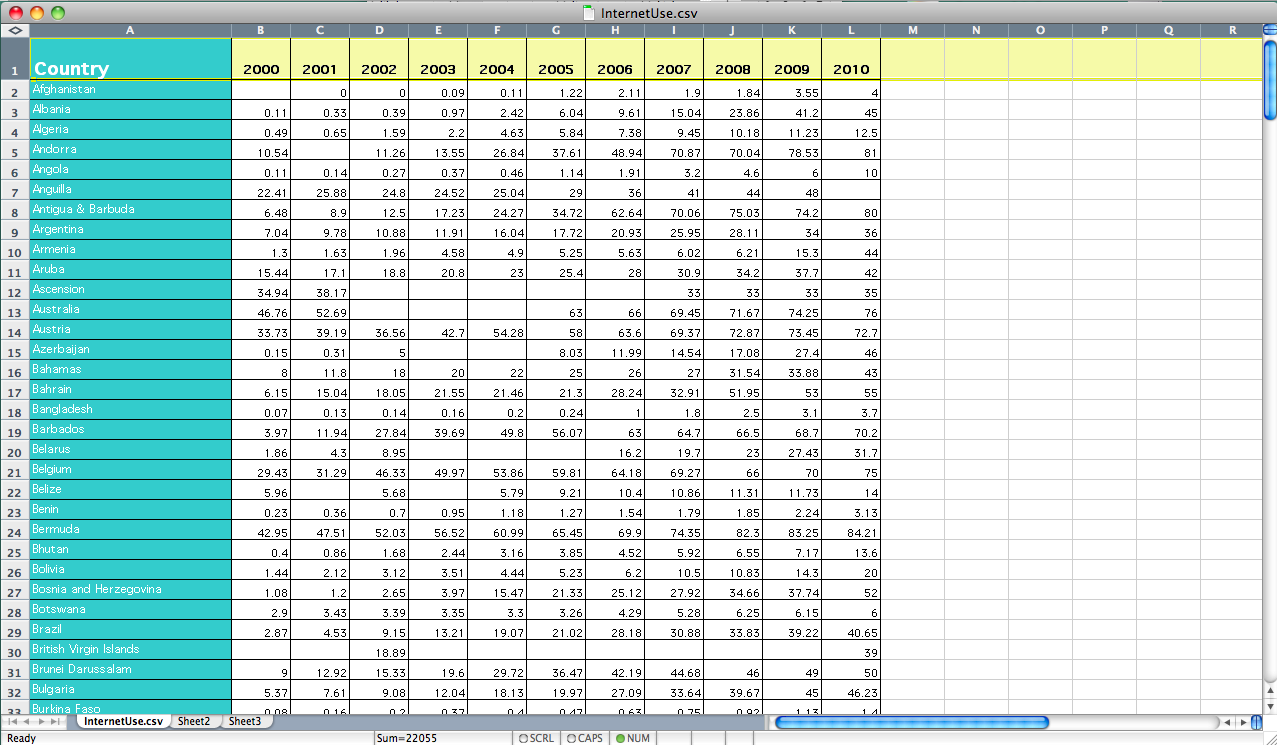
After the data are downloaded it is necessary to reformat the data so that they can be imported into Cartographica. Open the data in a spreadsheet application. The spreadsheet has additional information that we do not need. The data in column M and beyond is metadata that provides information about the sources of data. Metadata is very important in GIS, but for this example we can delete it. Highlight all of the columns to the right of column M and delete them. Also delete row 1. This should leave you with columns for country and years 2000-2010. Save the file as InternetUse.csv. I provide an image of the final dataset below.
Because the data are collected for countries we need a shapefile with the appropriate geographies. The website Geocommons1 has a free download for a world wide shapefile with countries. Once you download the shapefile open it in Cartographica by choosing File > Import Vector Data.
When the country shapefile is imported a yellow triangle will appear next to the layer in the Layer Stack. This indicates that the countries layer is missing a Coordinate Reference System (CRS). To set the CRS double click on the layer in the layer stack, then click on the arrows next to "World-Wide Projections" and then choose WGS 84 / Pseudo-Mercator and then click "Set". The yellow arrow should disappear from the layer stack.
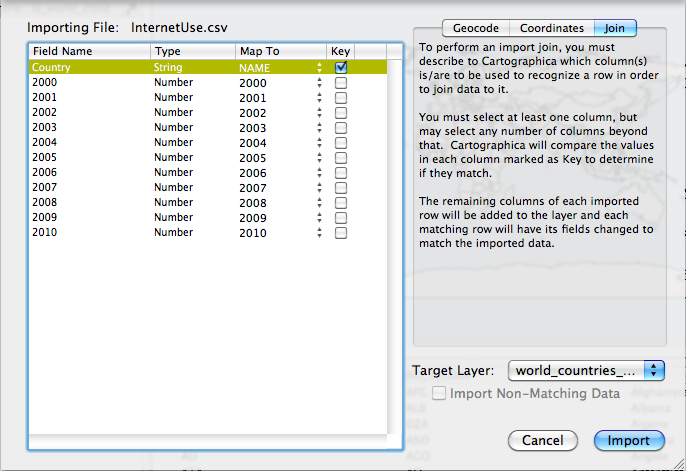
Now that the countries data are set we can join the Internet Usage data and then create maps. To join the Internet Usage data choose File > Import Table Data. Select the Join tab in the top right of the window. Change the Target Layer men to world_countries_… Change the Map to column in the Country row to Name and then check the box under the key column. I provide a screenshot to show the set up… Once its ready, click Import.
Now we are ready to create choropleth maps. Double click on the world_countries.. layer in the Layer Stack. This will bring up the Layer Styles window. Change the Based on menu to 2005. Click on the + button 7 times to create 7 categories. Next, click on the gear and choose Distribute with Natural Breaks (Jenks).
To change the color scheme choose Window > Show Color Palettes. Choose a color palette and drag it to the table in the Layer Styles Window.
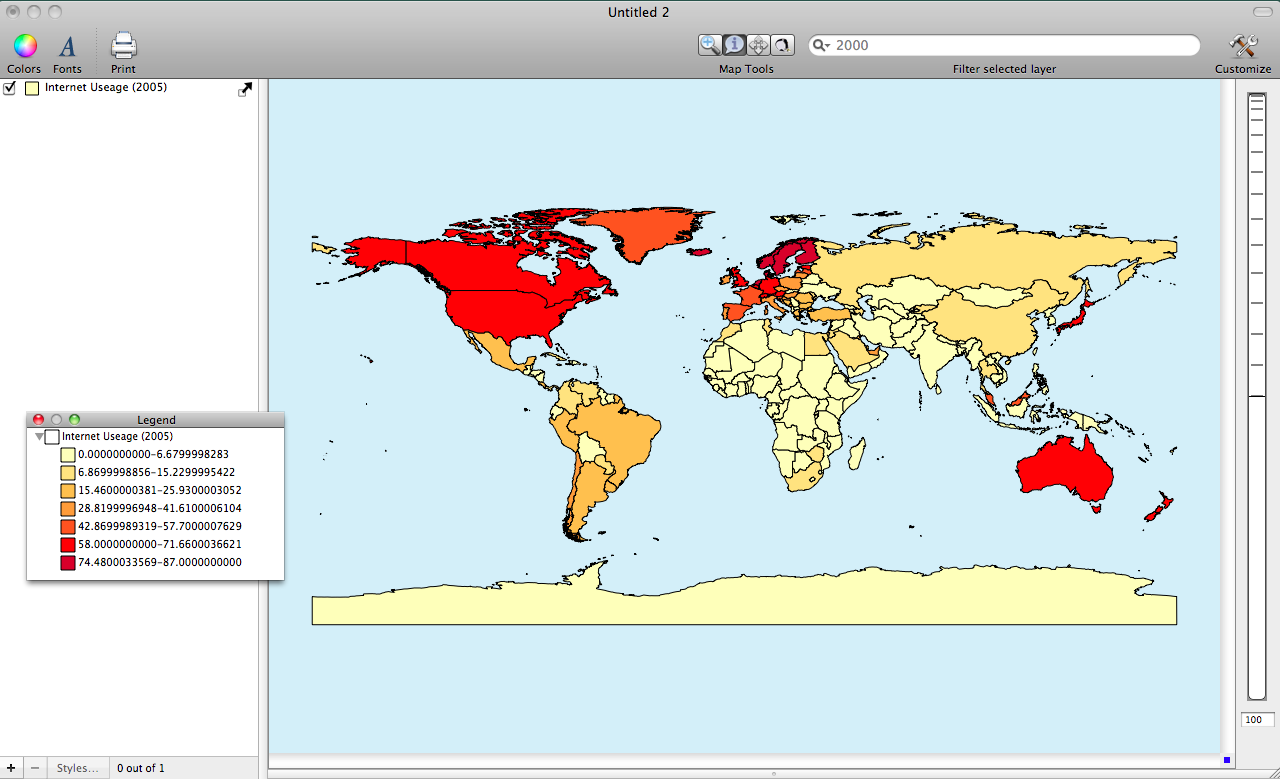
The first image below shows the percent of population in 2005 who use internet.
To take advantage of the time-series data we can create a new variable that indicates how much change in internet use there has been over the last ten years in each country. To create a new variable choose Window > Show Layer Info. Click on the + button to add a new column. Find the New Column in the Layer Info window and rename it Change. Also, change the variable type to Number for the Change variable. The image below shows that Set Formula Window
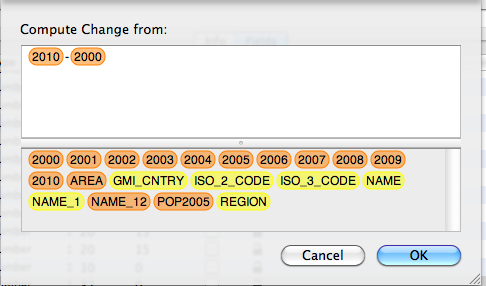
Next, click Set Formula and then set up the equation 2010 - 2000 by dragging the appropriate years into the top window of the Set Formula window and then click OK (be sure to separate them with a "-" sign)
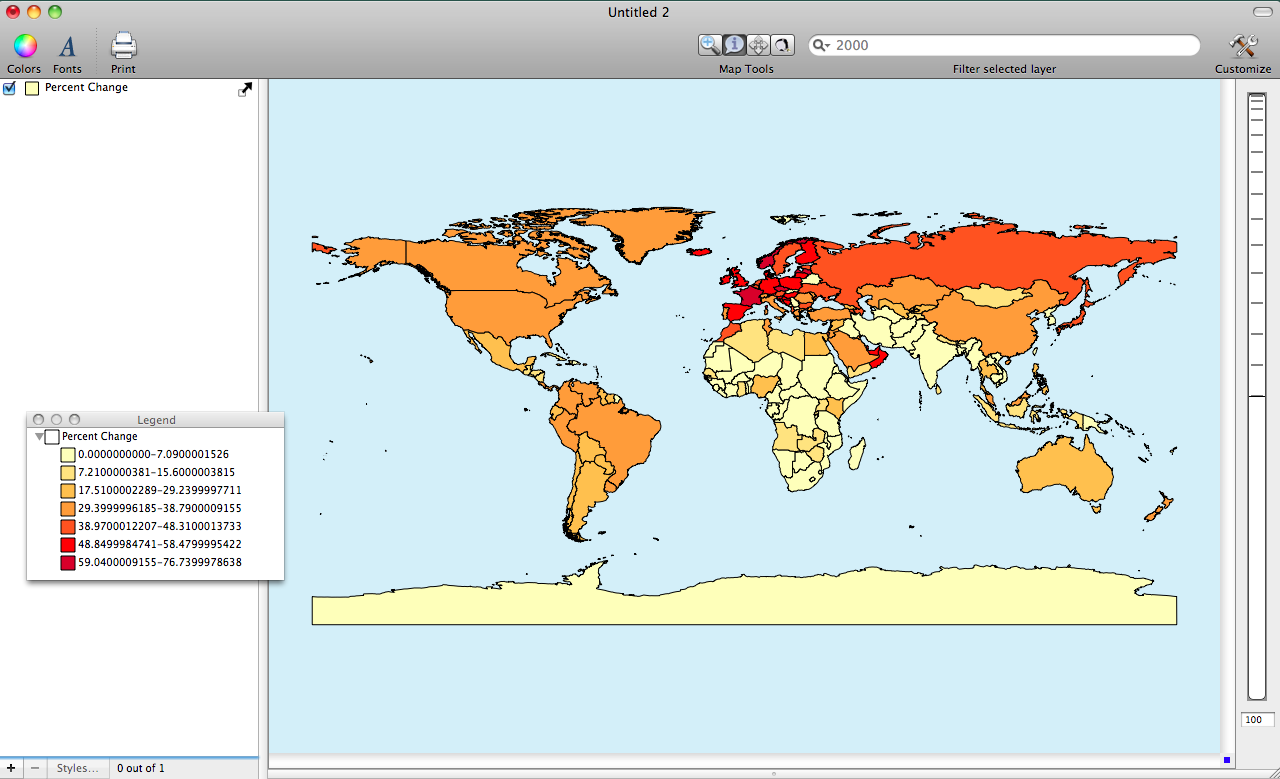
To create the map with the change variable double click on the world_countries… layer in the layer stack and then change the Based on menu to Change and then click on the gearbox and choose Distribute with Natural Breaks (Jenks) The change map is shown below.
-
GeoCommons was subsumed into ArcGIS and this data isn't available through a direct link any longer. ↩