- Tue 14 February 2012
- Cartographica
- Rick Jones
- #choropleth, #join, #population
For this post I found data on Statistics Canada, which is a governmental website that provides access to data on various topics within Canada. The website includes spatial data for creating maps and variable data for creating tables. To start you need to get a spatial file. I decided to get data for Provincial regions within Canada. To download the Provincial Regions shapefile to the Provincial Region Page and click on the link "ger_000b11a…."
After you download the shapefile import it into Cartographica by choosing File > Import Vector Data.
To download basic population data on Canadian provinces and territories go to the population data page and click on the first "CSV (comma-separated values)" link to download the data.
Open the data in a spreadsheet application. The data are downloaded with additional information that is not needed for creating maps in Cartographica. To clean the data delete the second row, which contains data on all of Canada and delete any row below row 16. Once you have deleted the extra information save the file as Canada_Prov
Next, import the data into Cartographica by choosing File > Import Table Data. This will open the Import Files Window.
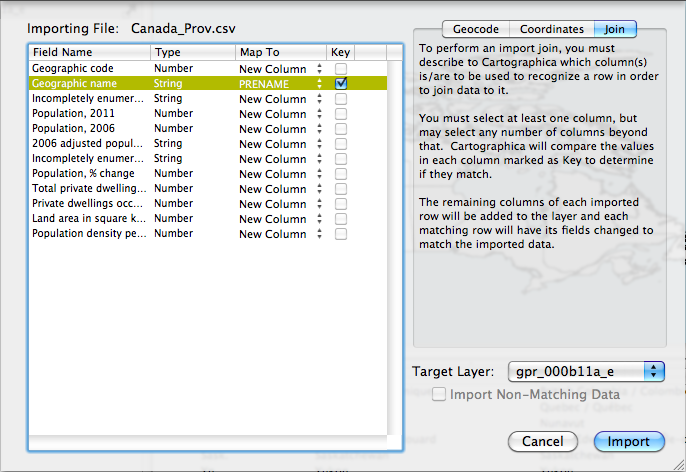
Next, select the Join tab in the top right of the Import File Window. Change the Target Layer menu to "gpr_000b…". Next, in the table on the left side of the Import File Window change the "New Column" option to PRENAME for the "Geographic name" row. I provide a screenshot below to show the set up. Once ready, click Import.
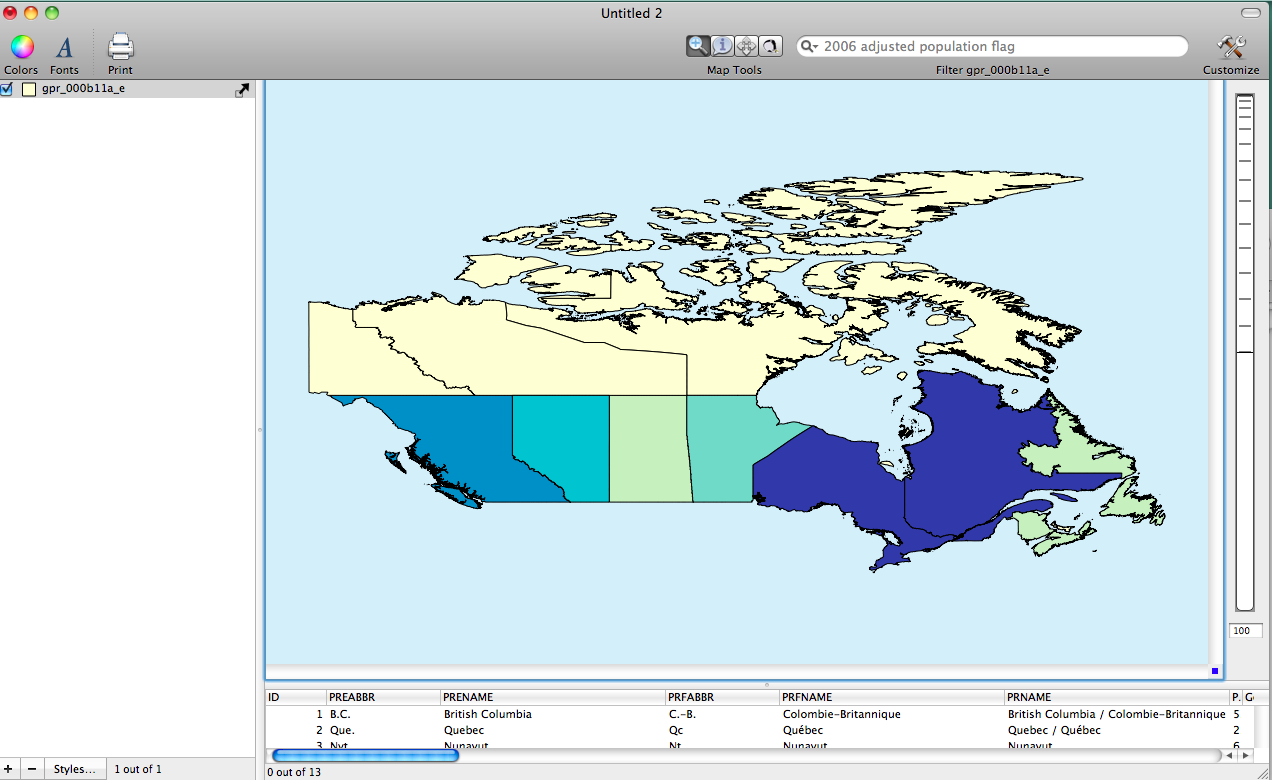
Now that the data are joined together you can use the attribute data to create maps. I created the population map shown below by first double clicking on the "gar…" layer in the layer stack to bring up the Layer Styles Window.
Inside the Layer Styles Window, change the Based on menu to Population, 2011. Click on the + button six times to add six categories to the table. Next, click the gear box and then choose Distribute with Natural Breaks (Jenks). Finally, add a color palette by choosing Window > Show Color Palettes. This will bring up the Color Palettes window. Here you can create a new color palette, use an existing palette or go to another source like to create a color palette.
For this post I decided to create a new color palette on the Color Brewer website. See this blog post on Cartographica.com to get steps for using Color Brewer with Cartographica. Follow the steps to create your own Color Brewer palette. I provide a screenshot of the Color Palettes Window with the Color Brewer ramp included.

Once you have the new color palette create click and drag it to the table within the Layer Styles Window. This will automatically assign the appropriate colors to the Canadian Provinces. I provide a screenshot of the final map below.
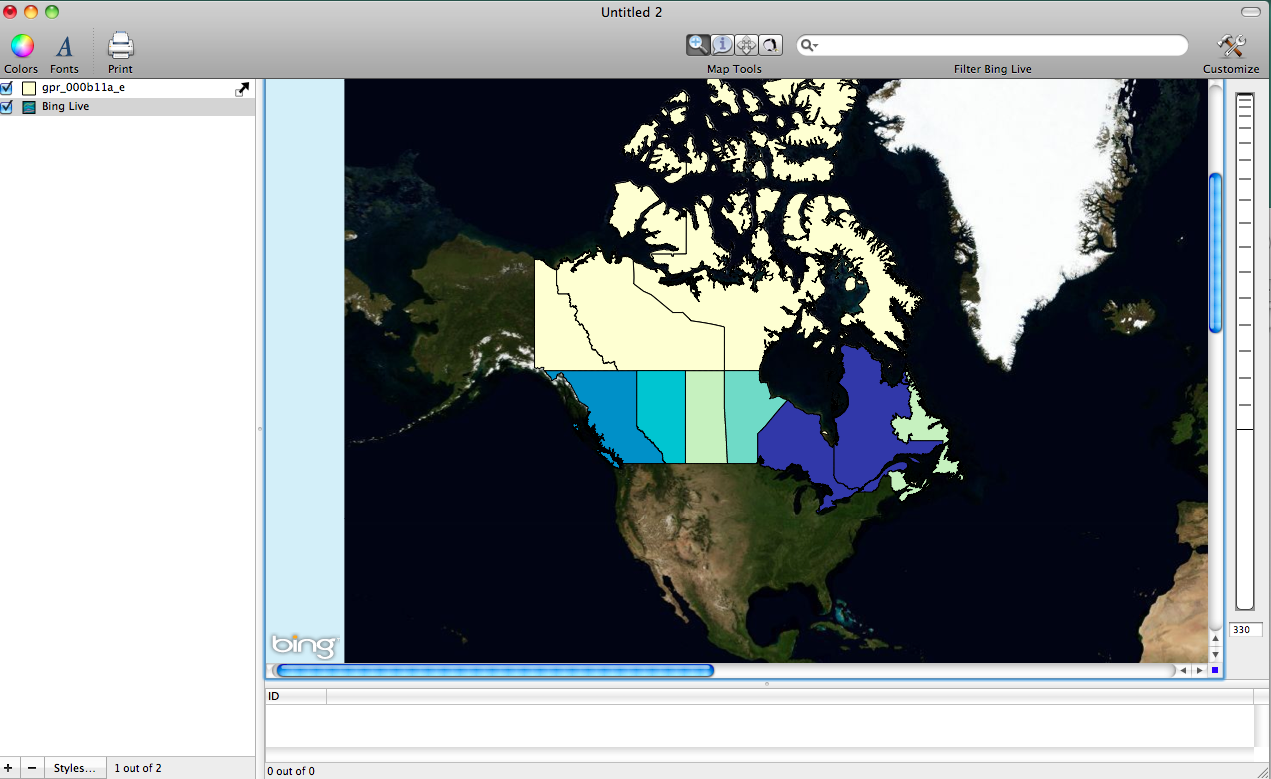
Also I provide a second map with a Live Map added to give a little more context to the population map. To add a live map choose File > Add Live Map. Notice that when the Live Map is added the projection for the Canadian shapefile changes.