- Thu 06 December 2012
- Featured Maps
- Rick Jones
- #CartoMobile, #Cartographica, #Field Work, #georeference
The United States National Park Service maintains and controls more than 84.4 million acres of park land in the United States. Much of the land is historical in nature and has been preserved for future generations to enjoy and learn about the various parks. The use of the parks is as varied as the many historical and ecological characteristics that define each unique location. One of the most popular types of parks within the United States are National Military Parks. These parks are typically located on the sites of famous battlefields and other important historical and strategic locations around the country. Among the popular locations for park visitors is the National Military Park at Gettysburg, Pennsylvania. Gettysburg was the location of one of the most important battles during the U.S. Civil War. The battle lasted three days and there were approximately 53,000 casualties combined. Gettysburg is also the location where Abraham Lincoln gave his most famous speech, The Gettysburg Address. Due to the significance of the battle the Gettysburg National Military Park hosts more than one million visitors per year as they take in the natural beauty of South-Central Pennsylvania and attempt to understand the military and historical significance of the battlefield.
Having personally been to Gettysburg I can attest to the fact that the battlefield is quite large, and has a wide range of positions that are challenging to understand. This is especially true when you want to know where specific units and specific generals were located on the battlefield. The National Park Service has constructed monuments to give some idea about the locations of various units, but I think we can make the location awareness even better. In the following example, we highlight the ways in which Cartographica's and CartoMobile can be used to improve location awareness in the field.
The process that is to be described involves a number of steps that we can summarize here.
- Locate a map of the positions of both armies. The image can be found by performing a Google search. To streamline the process I decided to only create layers for the infamous Pickett's charge that occurred on the third and final day of the battle. The map I used can be downloaded on the Pickett's Charge Wikipedia page
- Georeference the army position map using Cartographica. To georeference the image I used Cartographica's powerful suit of raster tools. To view the process for georeferencing an image check out the following links: Georeferencing Cold War Images, How to georeference images with Cartographica. The process for georeferencing begins by importing a raster image by choosing File > Import Raster Data, and then choosing Edit > Georeference Image.
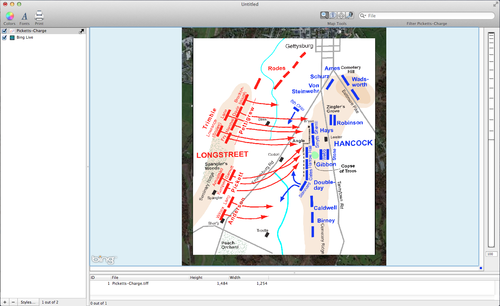
- Use the georeferenced image to create a polygon layer. In this step the goal is to use the georeferenced raster image to help draw new polygons in vector format. To draw new polygons first add a new layer by choosing Layer > New Layer. Next choose Edit > Add Feature. You will be prompted to select a layer type, select Polygon. At this point you can begin drawing new polygons by control clicking to add ground control points. The first image below shows the georeferenced Pickett's charge image.
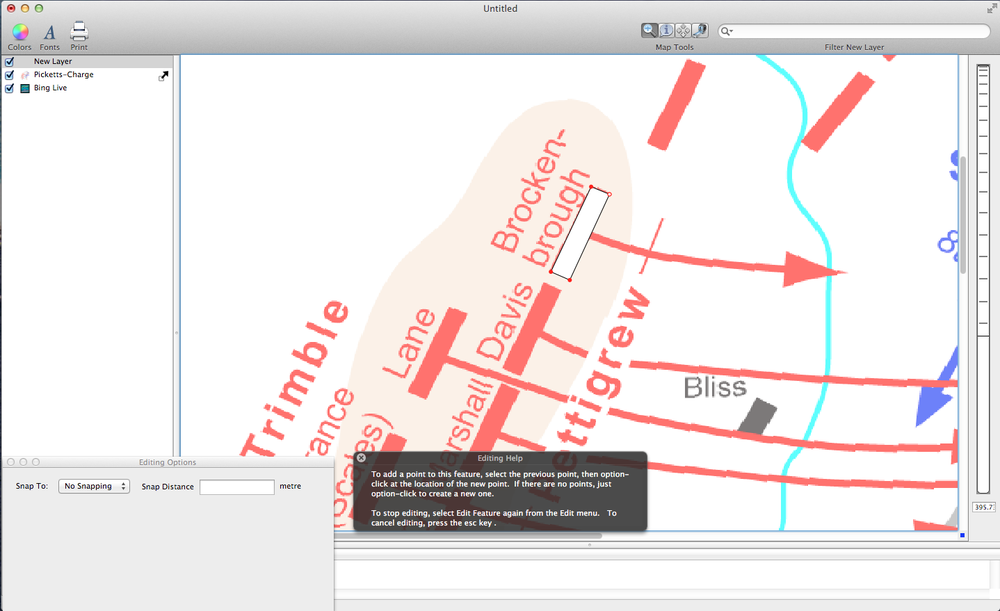
 The next image shows the new polygon being drawn.
 Note: when you look at the map there are a lot of individual units to draw. To make this process easier you can use Edit > Duplicate to quickly create an identical feature on the same layer. This allows you to quickly duplicate the first polygon you have drawn and simply drag it to the next unit position. For more information on adding features check out the following blog post, streamlining workflow when adding features.
The final unit position map (Note: the map below already has attribute data added, which is discussed next).
Note: when you look at the map there are a lot of individual units to draw. To make this process easier you can use Edit > Duplicate to quickly create an identical feature on the same layer. This allows you to quickly duplicate the first polygon you have drawn and simply drag it to the next unit position. For more information on adding features check out the following blog post, streamlining workflow when adding features.
The final unit position map (Note: the map below already has attribute data added, which is discussed next).
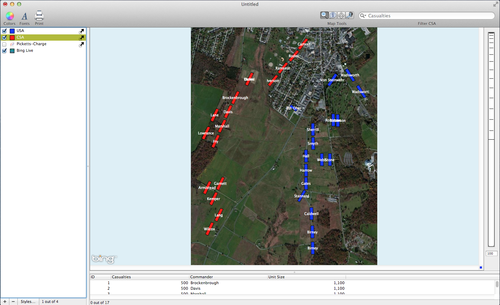
- Enhance the new polygon layers with additional attribute data. In the map above additional attribute data has already been added. Those attributes are the commander, unit size, and casualties of each unit during the battle. This step took a little additional research into what the units at the battle were comprised of. In general, my layers are estimates based on information about unit size, and casualties. Please do not take the numbers here as fact. Much more research is required to be more confident that these numbers are correct. To add a new variable/attribute choose Layer > Add Column. Next, you can manually enter each unit commander name by typing within the Data Viewer. In my quick research I found that brigades (the army units in the map) were comprised of about 1000 soldiers. Also I found that the Confederates lost approximately 50% of their soldiers during Pickett's charge, based on those number I created the Unit Size and Casualties attributes.
- Export the new polygon layers as shapefiles by choosing File > Export Layer's Features. Save the files to a desired location.
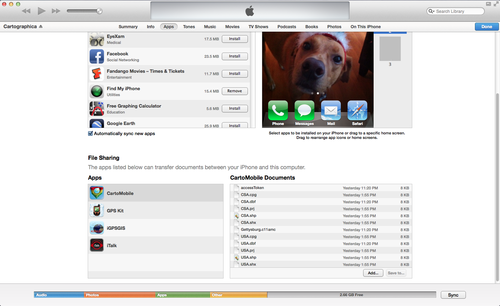
- Use iTunes to add the new army position shapefiles to your iPhone. Open iTunes and sync your iPhone. Go to Apps and click on Cartographica. At the bottom, under File Sharing, click Add and then add the new polygon layers showing the army units. The image below shows what the iTunes set up should look like. (Note, Sallie the Christmas dog at the top!)
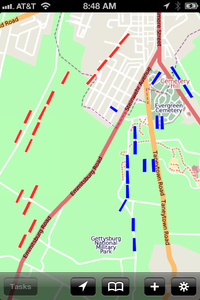
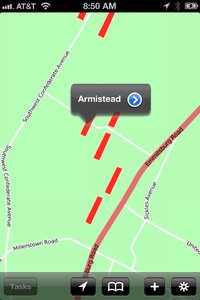
- Open the new shapefile in CartoMobile for quick reference while visiting the battlefield. See the images below.