- Thu 19 May 2011
- Cartographica
- Rick Jones
The Modifiable Areal Unit Problem (MAUP) is an important issue for those who conduct spatial analysis using units of analysis at aggregations higher than incident level. The basic issue with the MAUP is that aggregate units of analysis are often arbitrarily produced by whom ever is in charge of creating the aggregate units. A classic example of this problem is known as Gerrymandering. Gerrymandering involves shaping and re-shaping voting districts based on the political affiliations of the resident citizenry. The problem was first described by Openshaw (1984) when he stated "the areal units (zonal objects) used in many geographical studies are arbitrary, modifiable, and subject to the whims and fancies of whoever is doing, or did, the aggregating."
The inherent problem with the MAUP and with situations such as Gerrymandering is that units of analysis are not based on geographic principles, and instead are based on political and social biases. For researchers and practitioners the MAUP has very important implications for research findings because it is possible that as arbitrarily defined units of analysis change shape findings based on these units will change as well.
The MAUP has two important features: Zone and Scale. The scale problem involves results that change based on data that are analyzed at higher or lower levels of aggregation (Changing the number of units). For example, evaluating data at the state level vs. Census tract level. The zonal problem involves keeping the same scale of research (say, at the state level) but changing the actual shape and size of those areas.
We can use Cartographica to show an example of this problem...
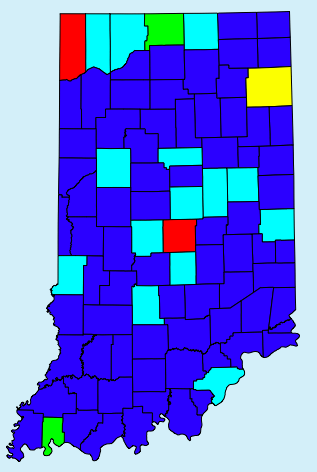
The first map shows the distribution of households across counties in the state of Indiana. Using the Natural Breaks reclassification method one can see that there is not much variation in the distribution of raw household counts across the state. Higher levels of households appear to be concentrated in only a few places.
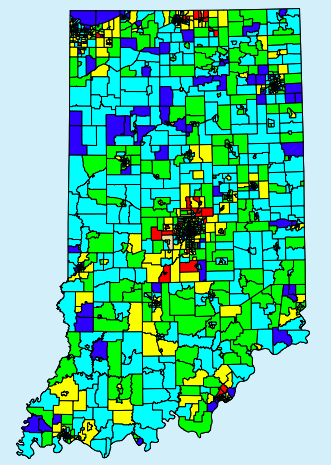
However, when one views the Census tract map it is clear that there is much more variation across the state with smaller units of analysis. It is easy to see that evaluating the impact that the number of households would be greatly impacted based on the scale of the evaluation.
The data used for this post were collected at Indiana Map